It’s the start of another year, so I have decided to change my updates slightly and only compare to the previous year
I will still detail my savings compared to my pre solar costs, although I will ignore the gas comparisons, as there were a few months in my pre solar times that had silly and/or negative values, plus I am not really making any notable savings on the gas front as my gas prices were actually pretty good and are only really being beaten by the fact that I am on the Octopus tracker tariff.
January Electricity:
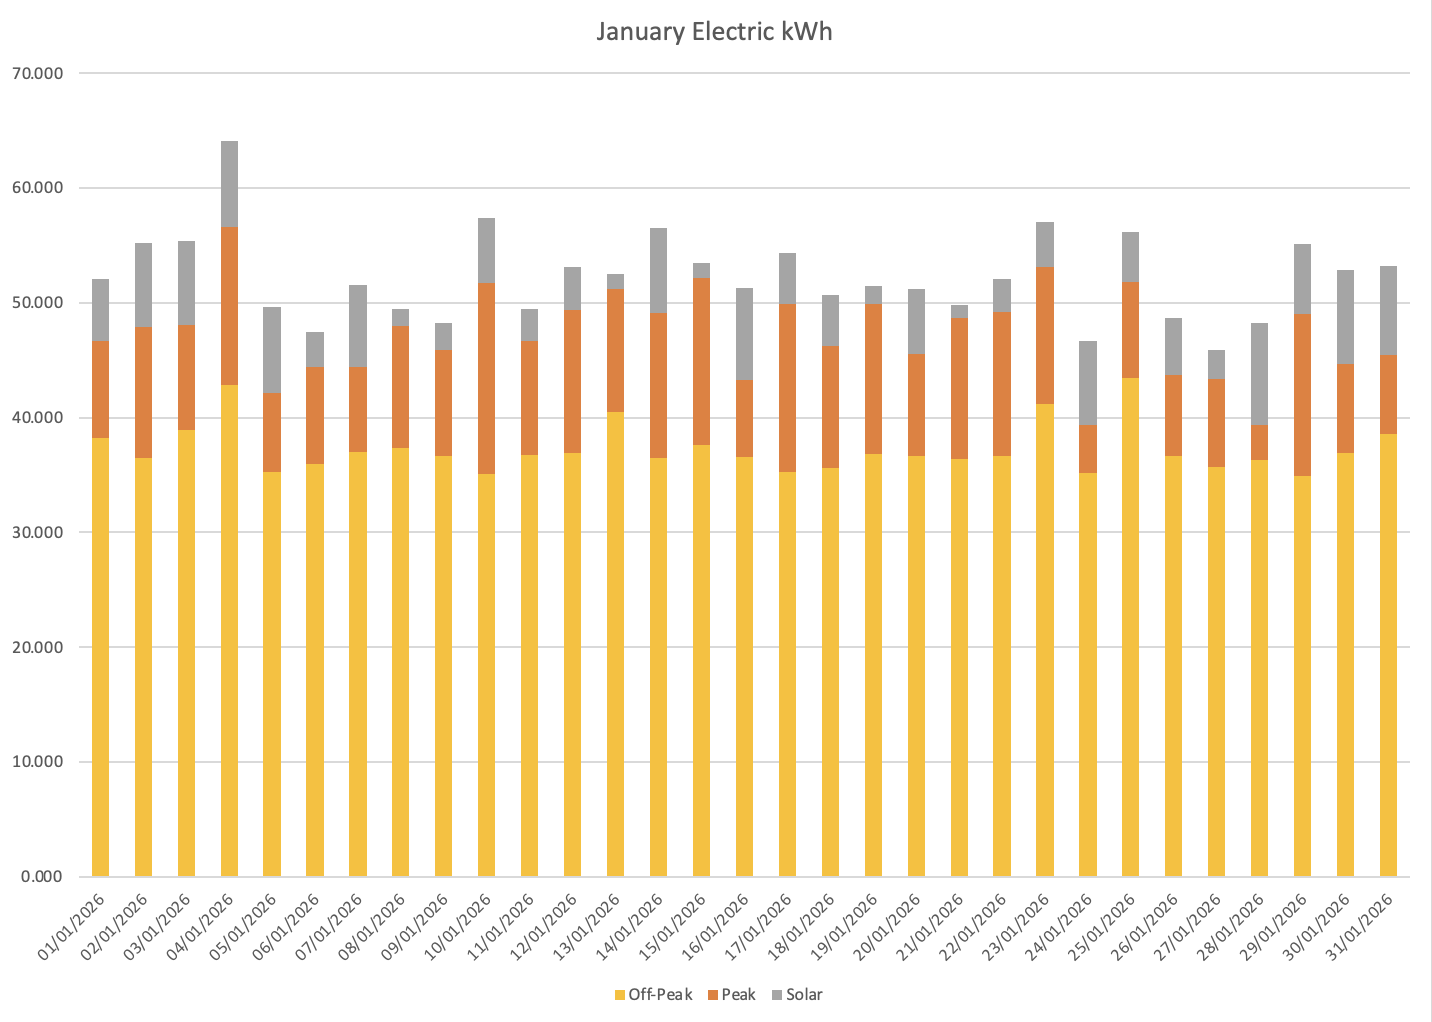
I managed to maintain a 20.93% Peak/Off-Peak ratio, compared to 46.28% in 2025 (I had not yet bought my 4th battery at this point).
Much of the month was overcast, and/or had minimal sunshine, but an average UK January.
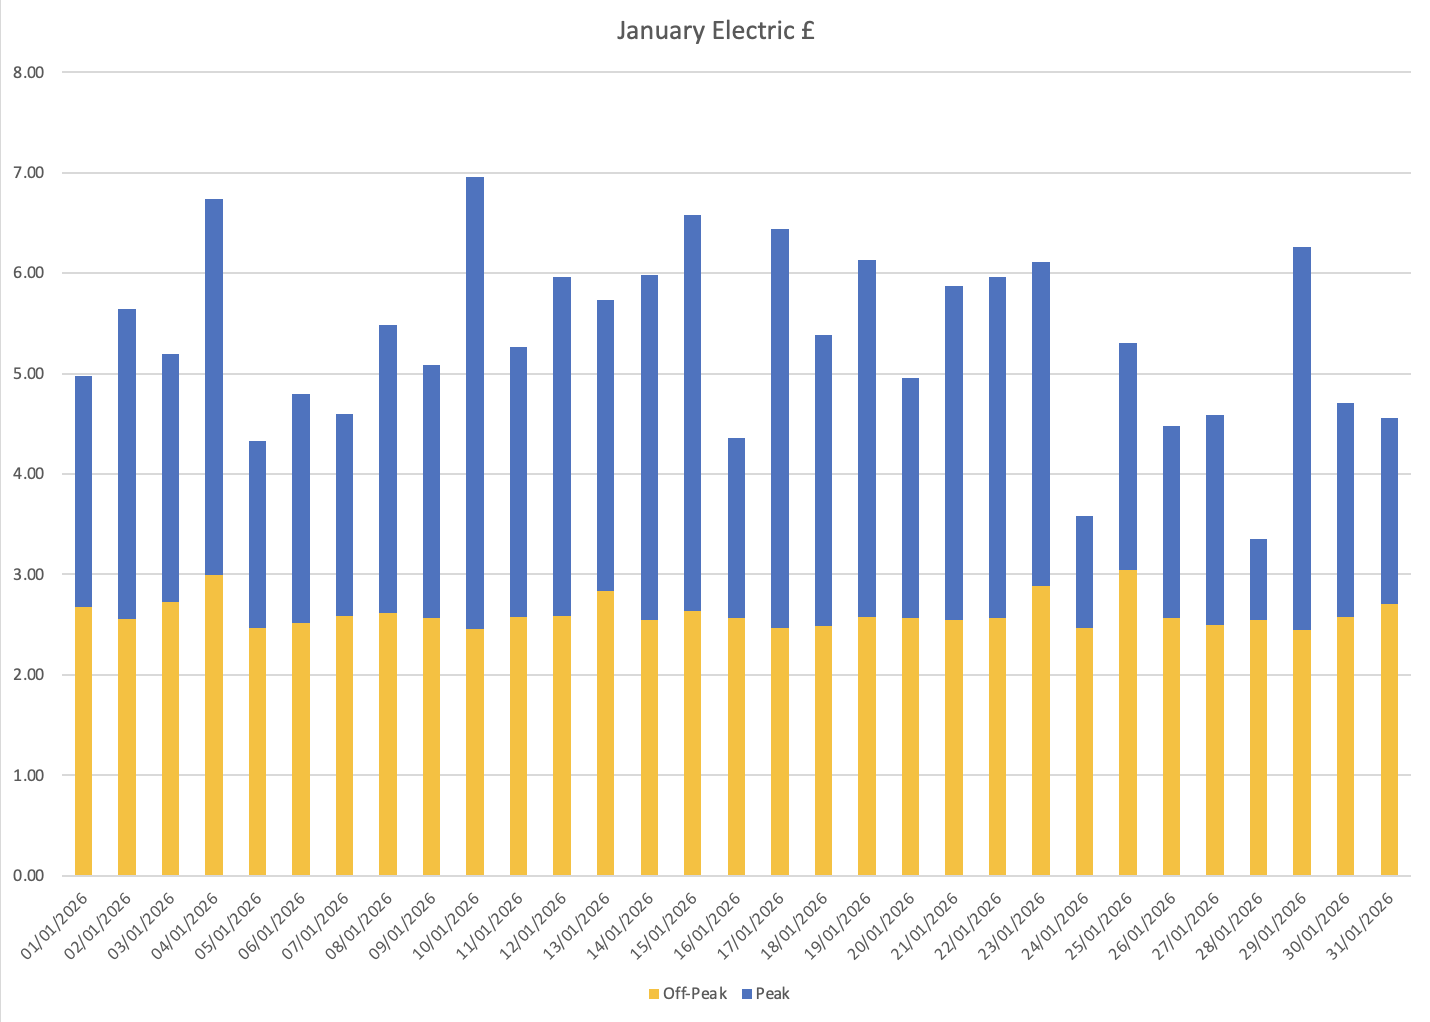
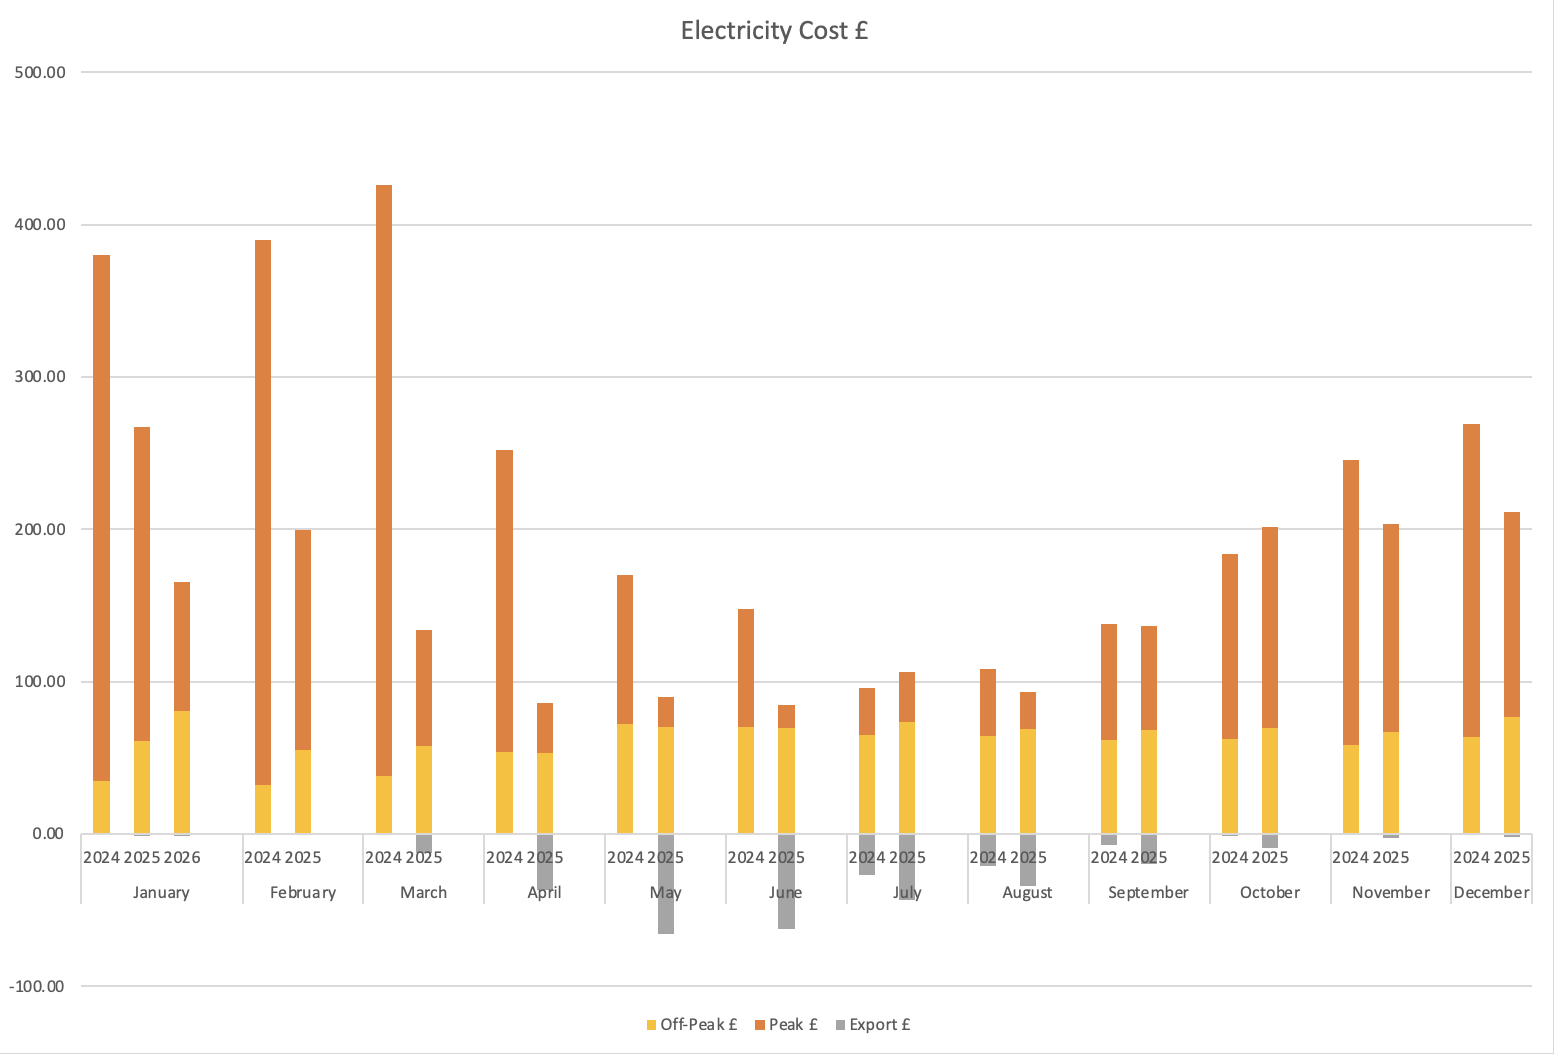
Electricity costs for the month of January: £180.70 for 2026, £226.31 for 2025.
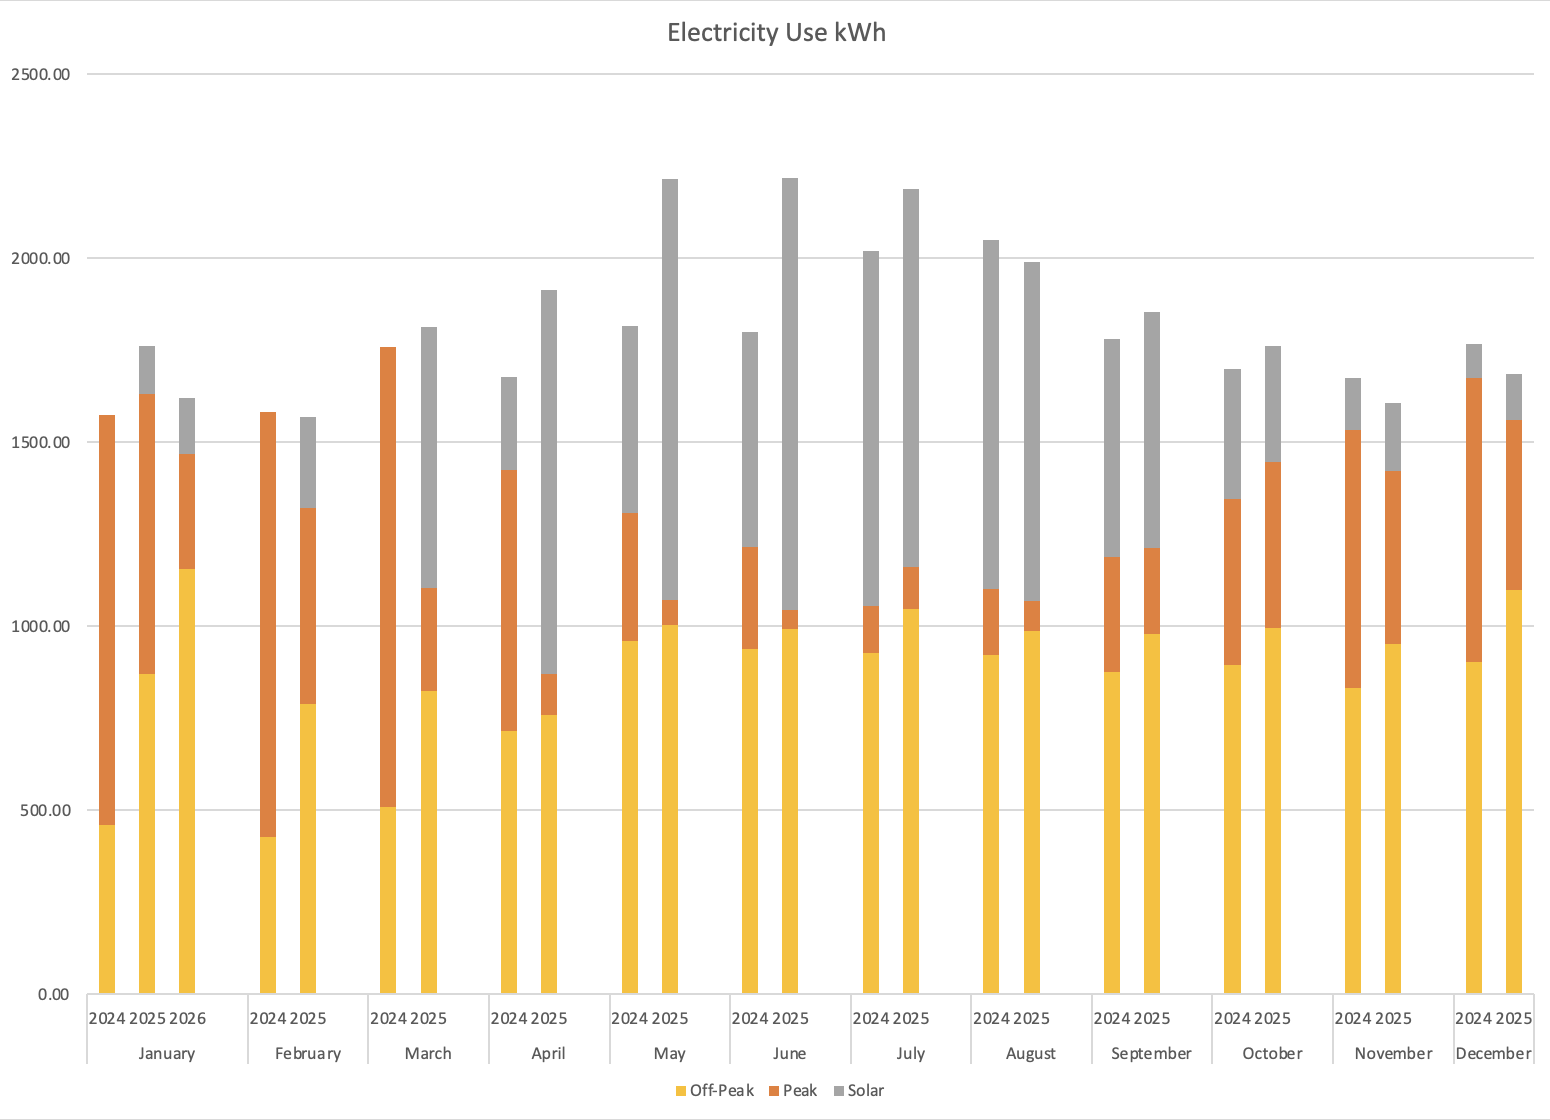
Electricity demand for the month of January: 1600Wh for 2026, 1631kWh for 2025.
The cost for this year was around £46.00 less for 31kWH less usage.
The off-peak/peak/SC values for January were £0.07/0.29198/0.47704 for 2026 vs £0.07/£0.27102/0.4879 for 2025, peak is slightly up, but the standing charge is down.
This can also be seen in the month on month usage vs cost graphs where my usage is about the same, however my costs have gone down significantly each year:
Ecoflow batteries:
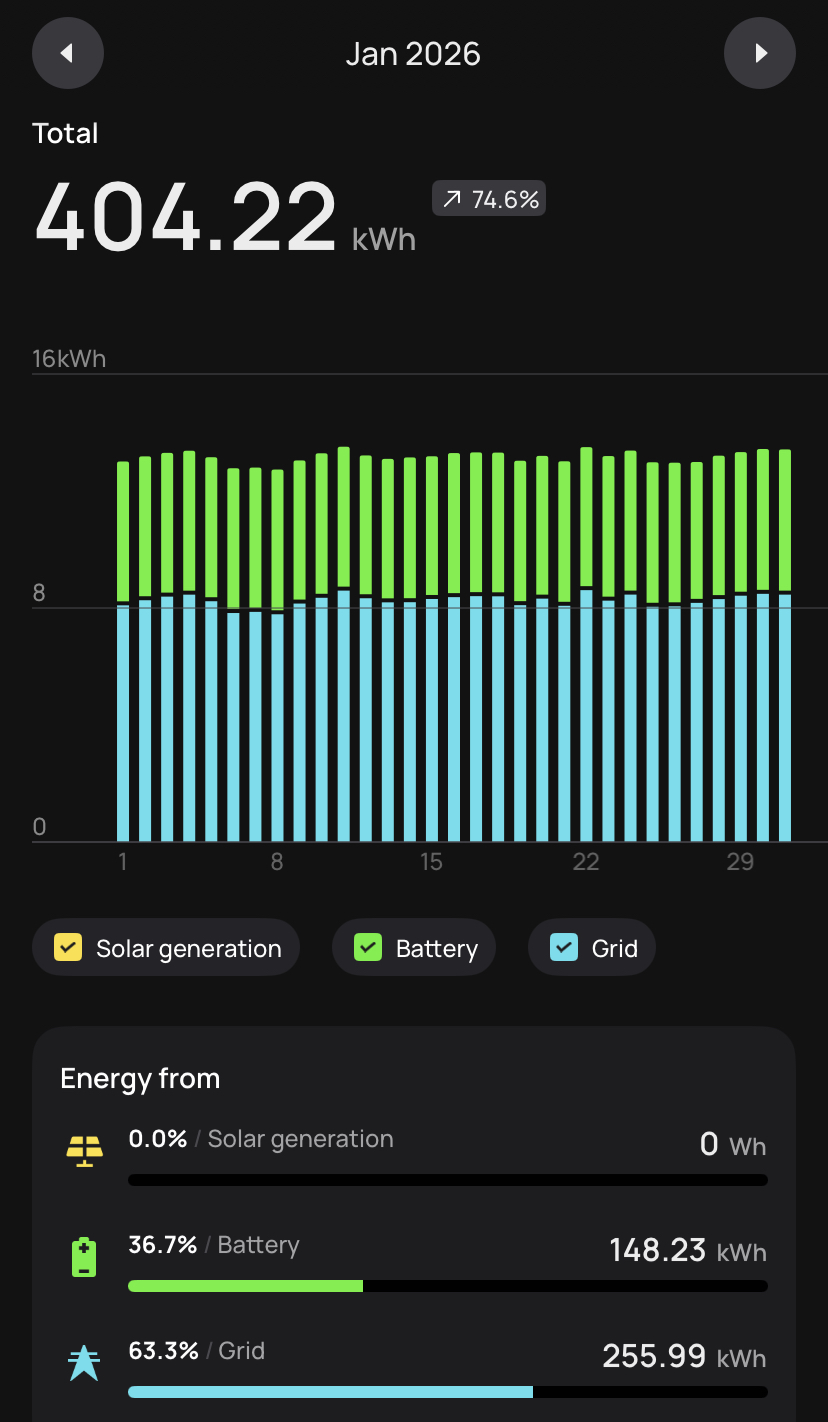
I currently have 3 of these batteries in active use, they charge from the grid during off-peak and then supply power to their attached appliances, the attached appliances draw continuously 24/7.
The graph shows a total of 404kWh of usage, 148kWh of which came from the batteries and 256kWh came from the ‘grid’ after the batteries were exhausted.
I have grid in inverted commas as this may/may not have been from my Enphase batteries, depending on their state of charge at the time, as such I will only consider the battery portion here and only assume that this part would otherwise have come from actual grid consumption
This means that I have moved an additional 148kWh of usage from peak to off-peak or £32.85 (148 * (0.29198 – 0.07)) of additional savings not captured elsewhere.
January Solar:
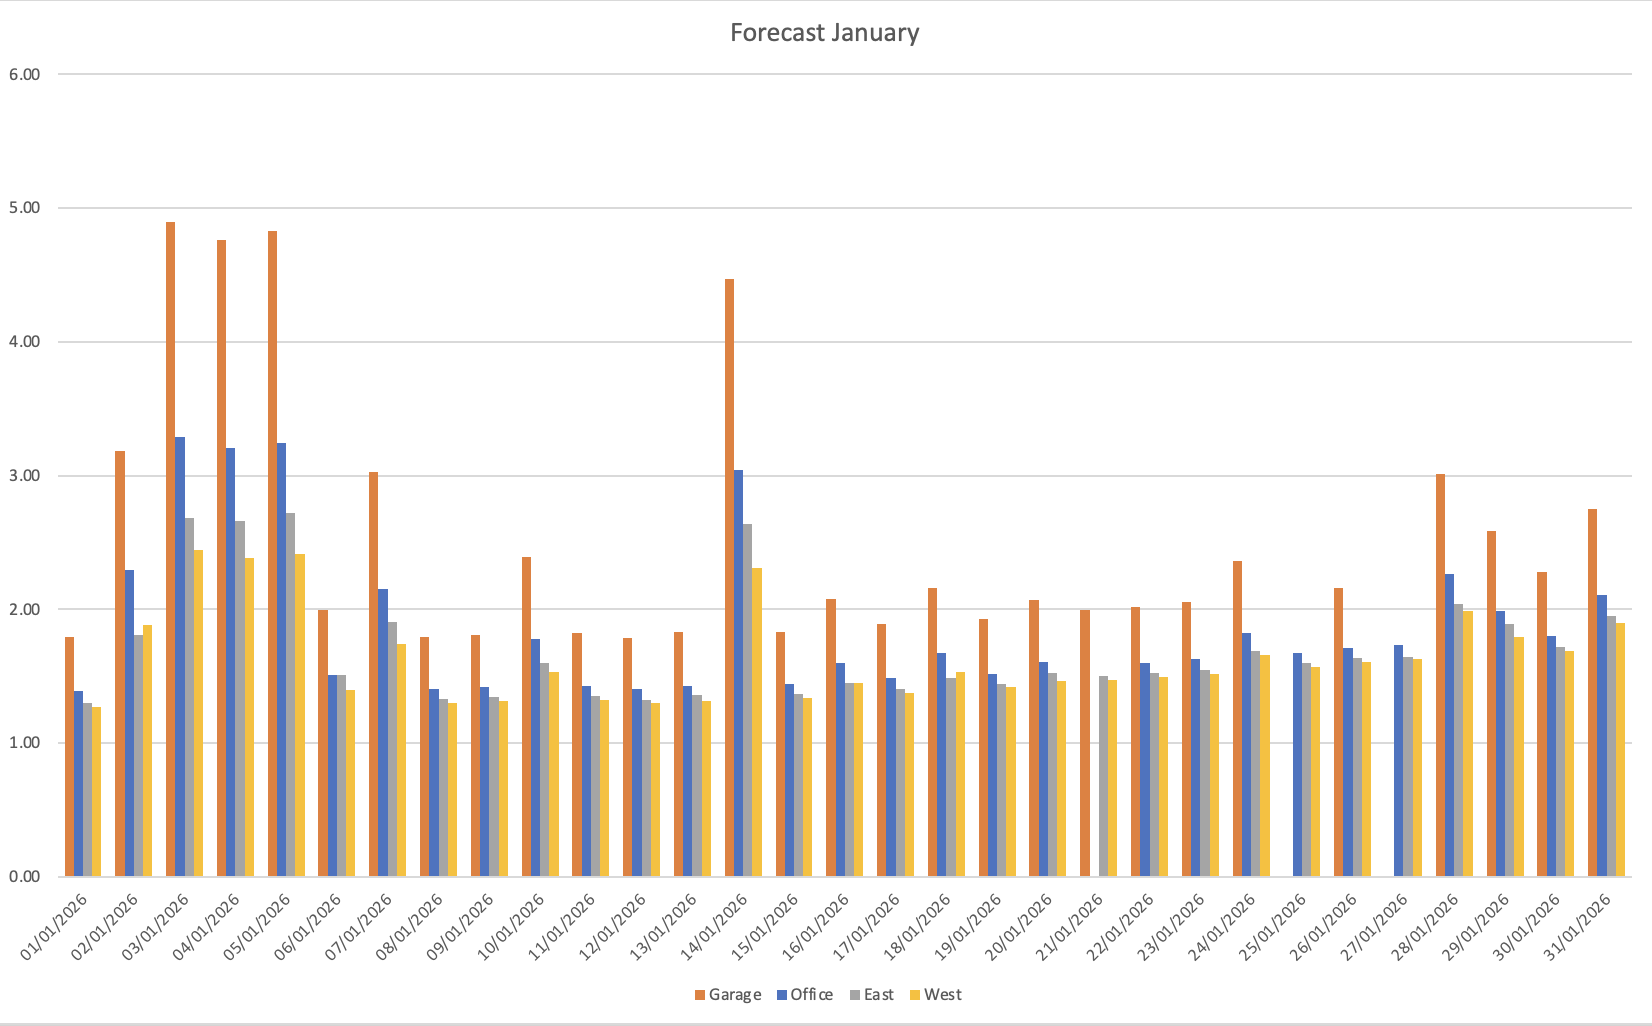
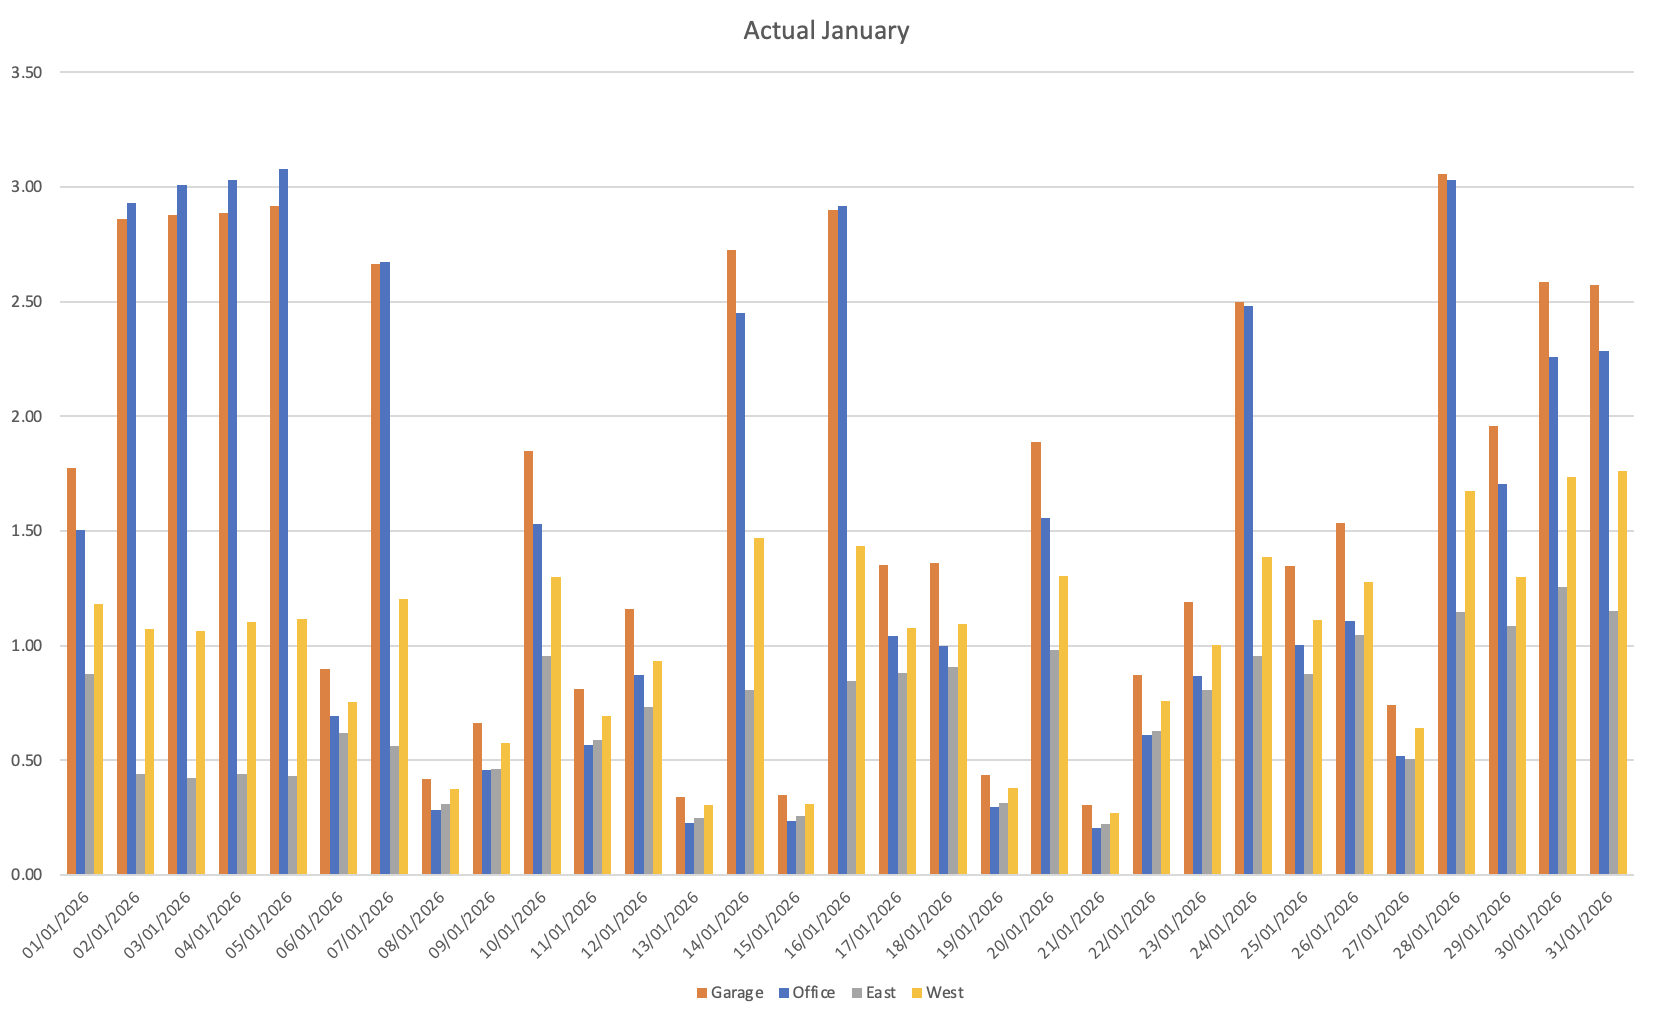
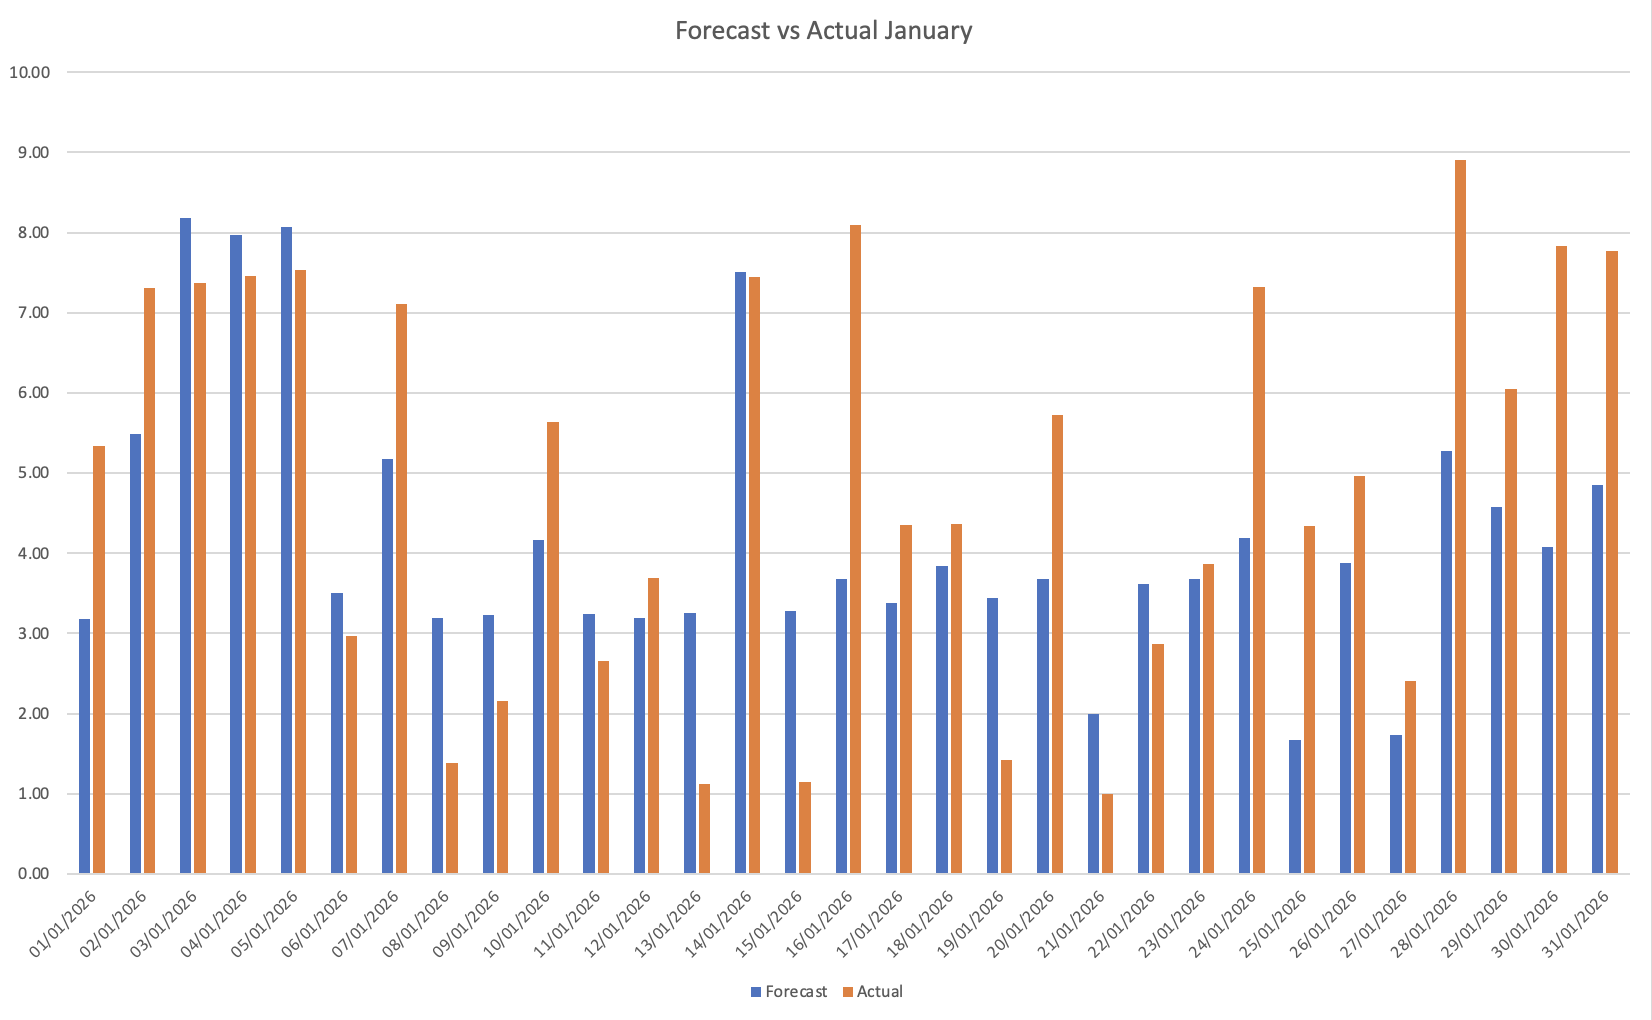
Actual production for January exceeded the forecast but not necessarily by very much.
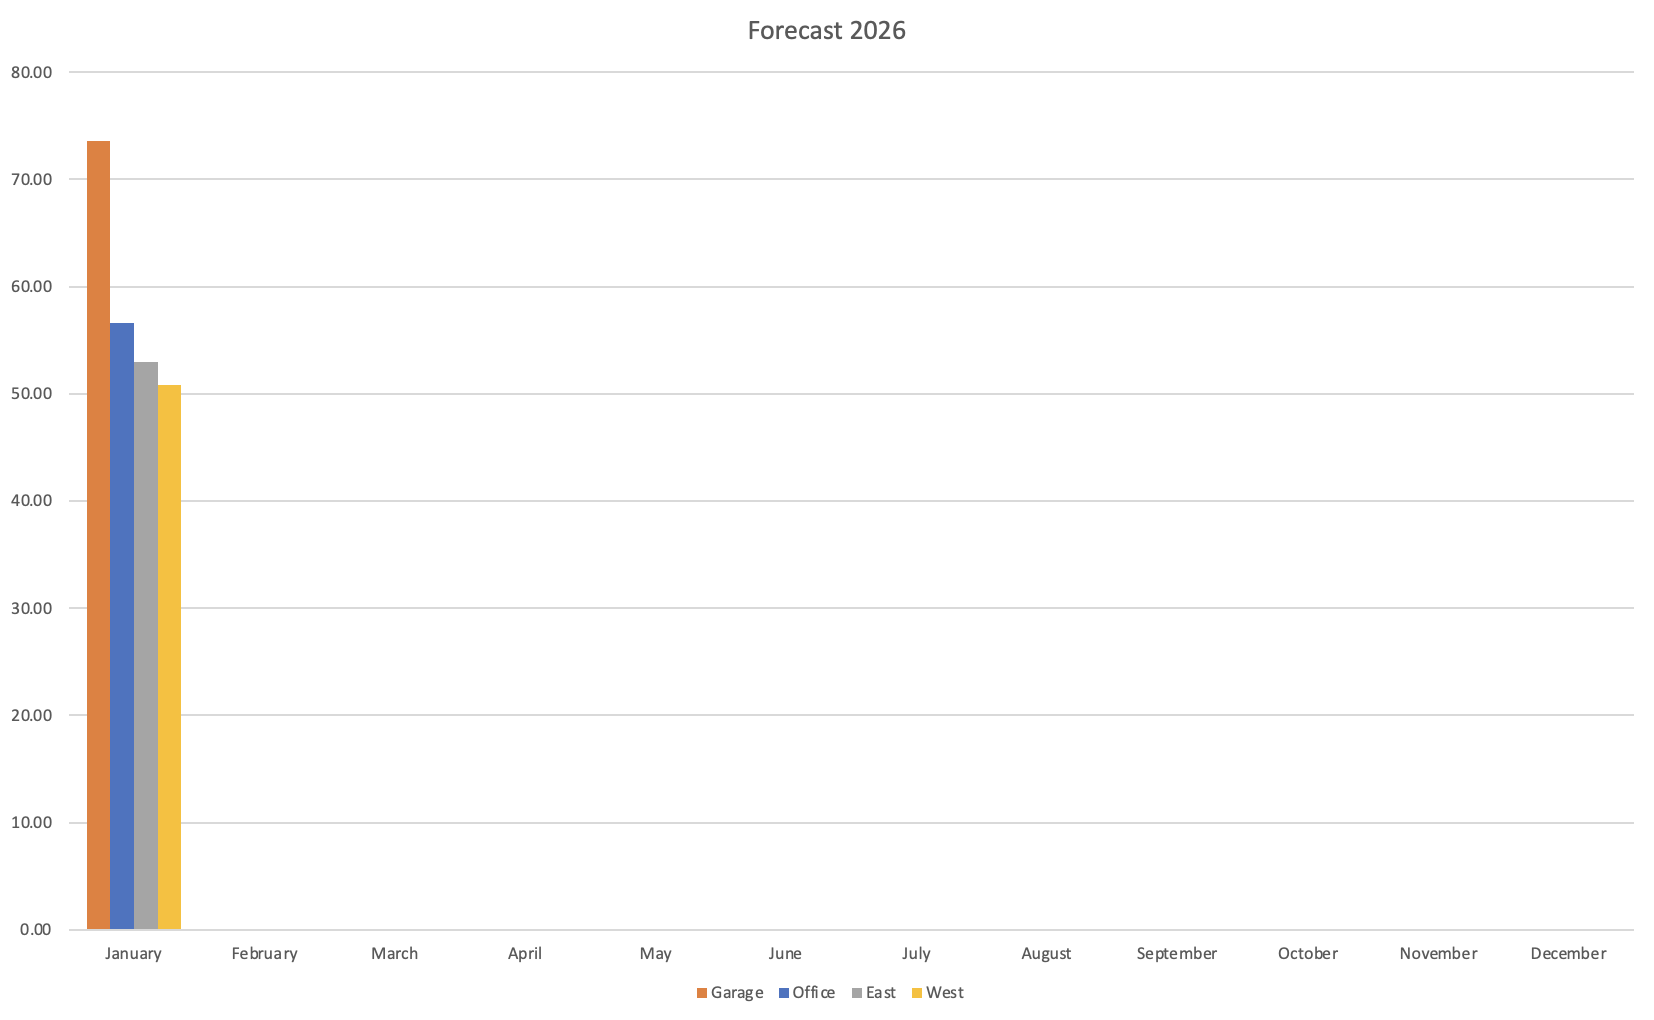
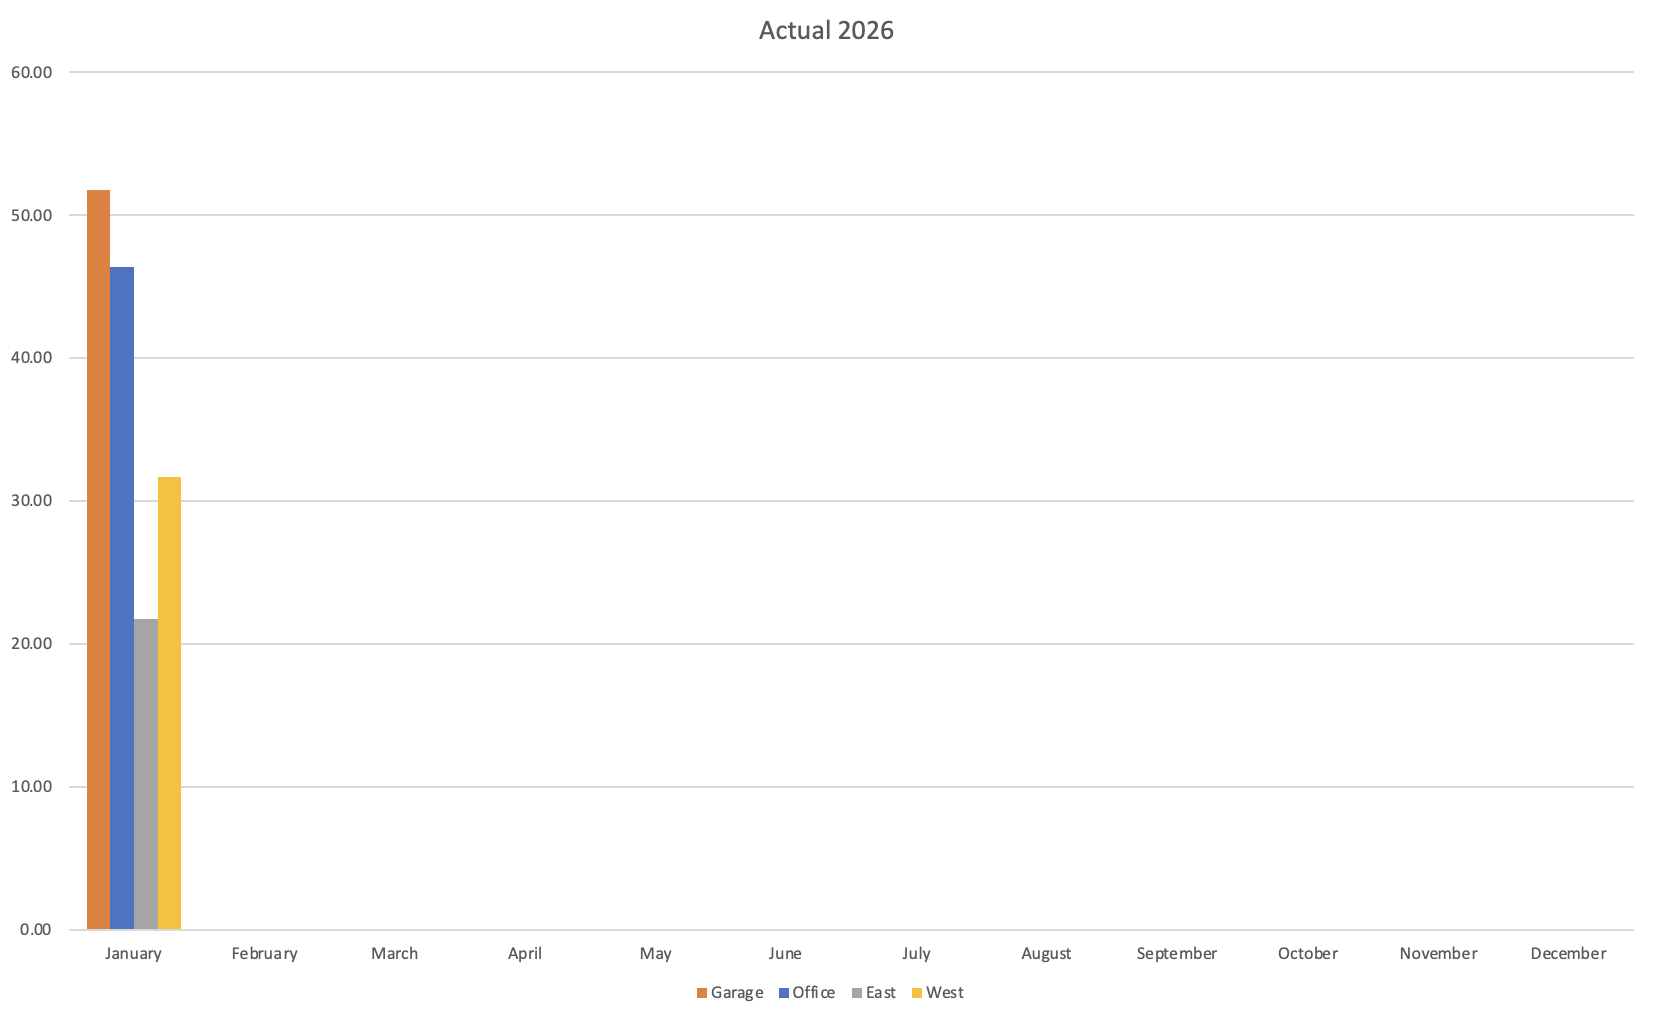
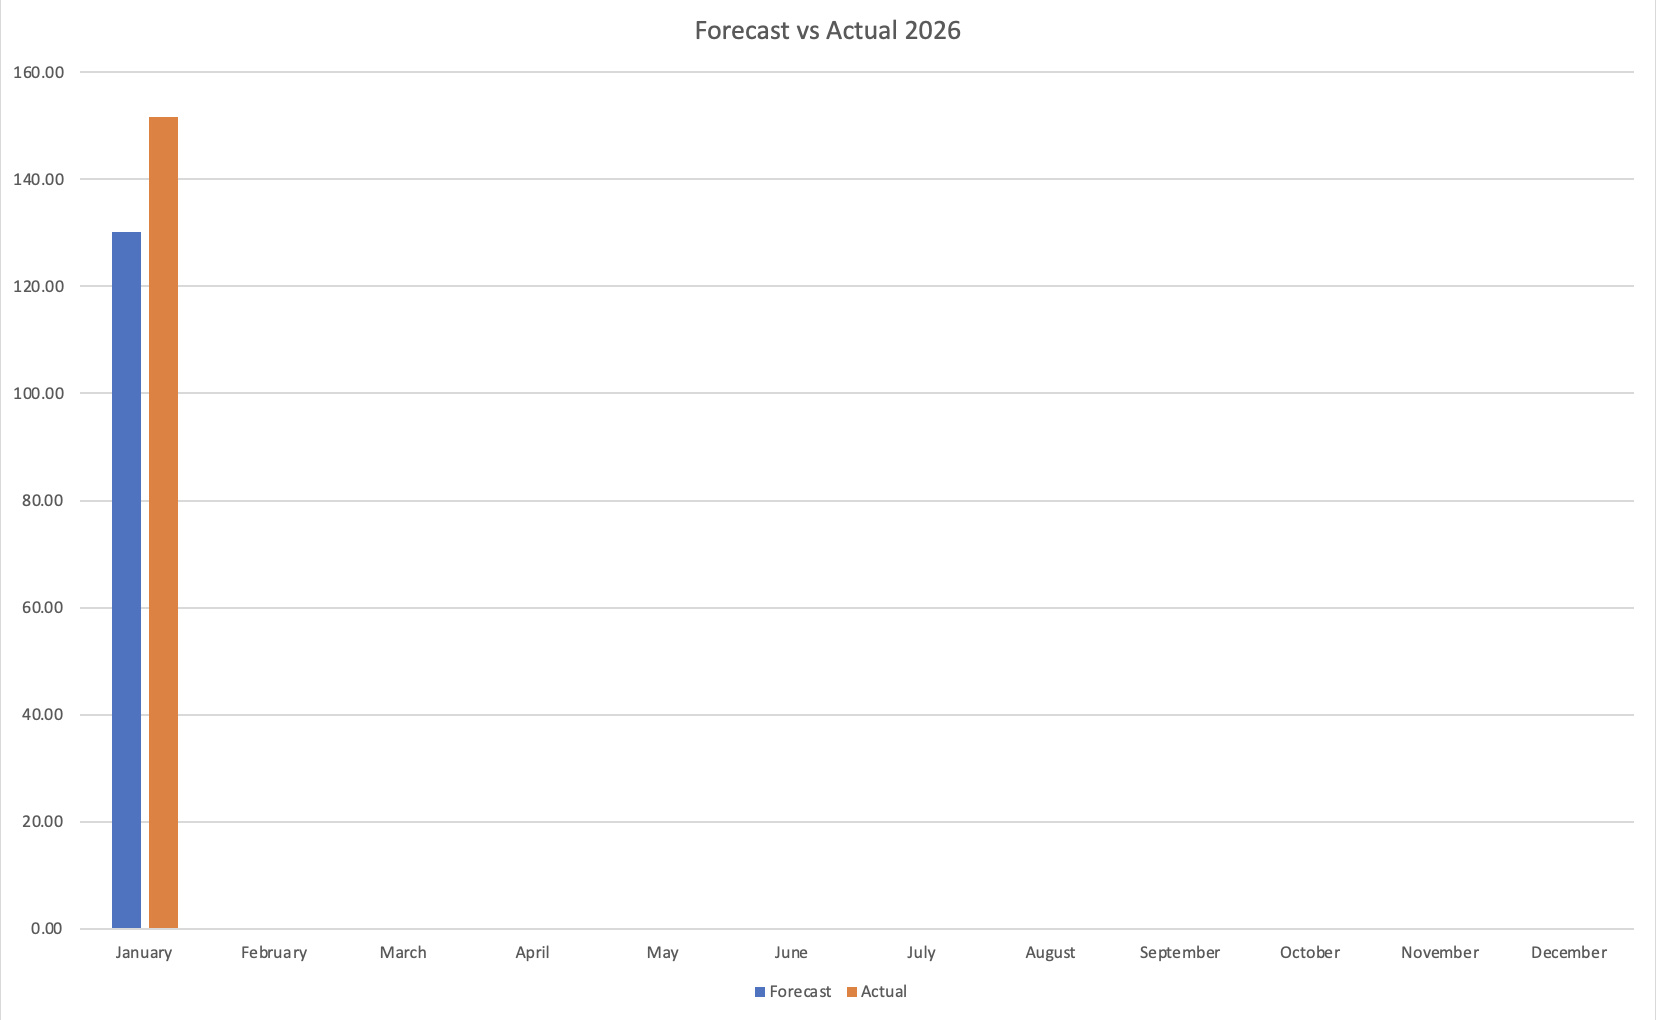
The various arrays produced the following levels of energy: Garage 51.77kWh, Office 46.40kWh, East 21.75kWh, West 31.65kWh for a total of 151kWh, this compares to 123kWh for January 2025, so a slight improvement there.
A relatively poor month for solar production, I managed to export 7.10kWh for a total saving of £1.07.
The import costs of £180.70 less the export savings of £1.07 means my net cost for January was £179.63 for 1600kWh of demand making my average rate £0.1157/kWh.
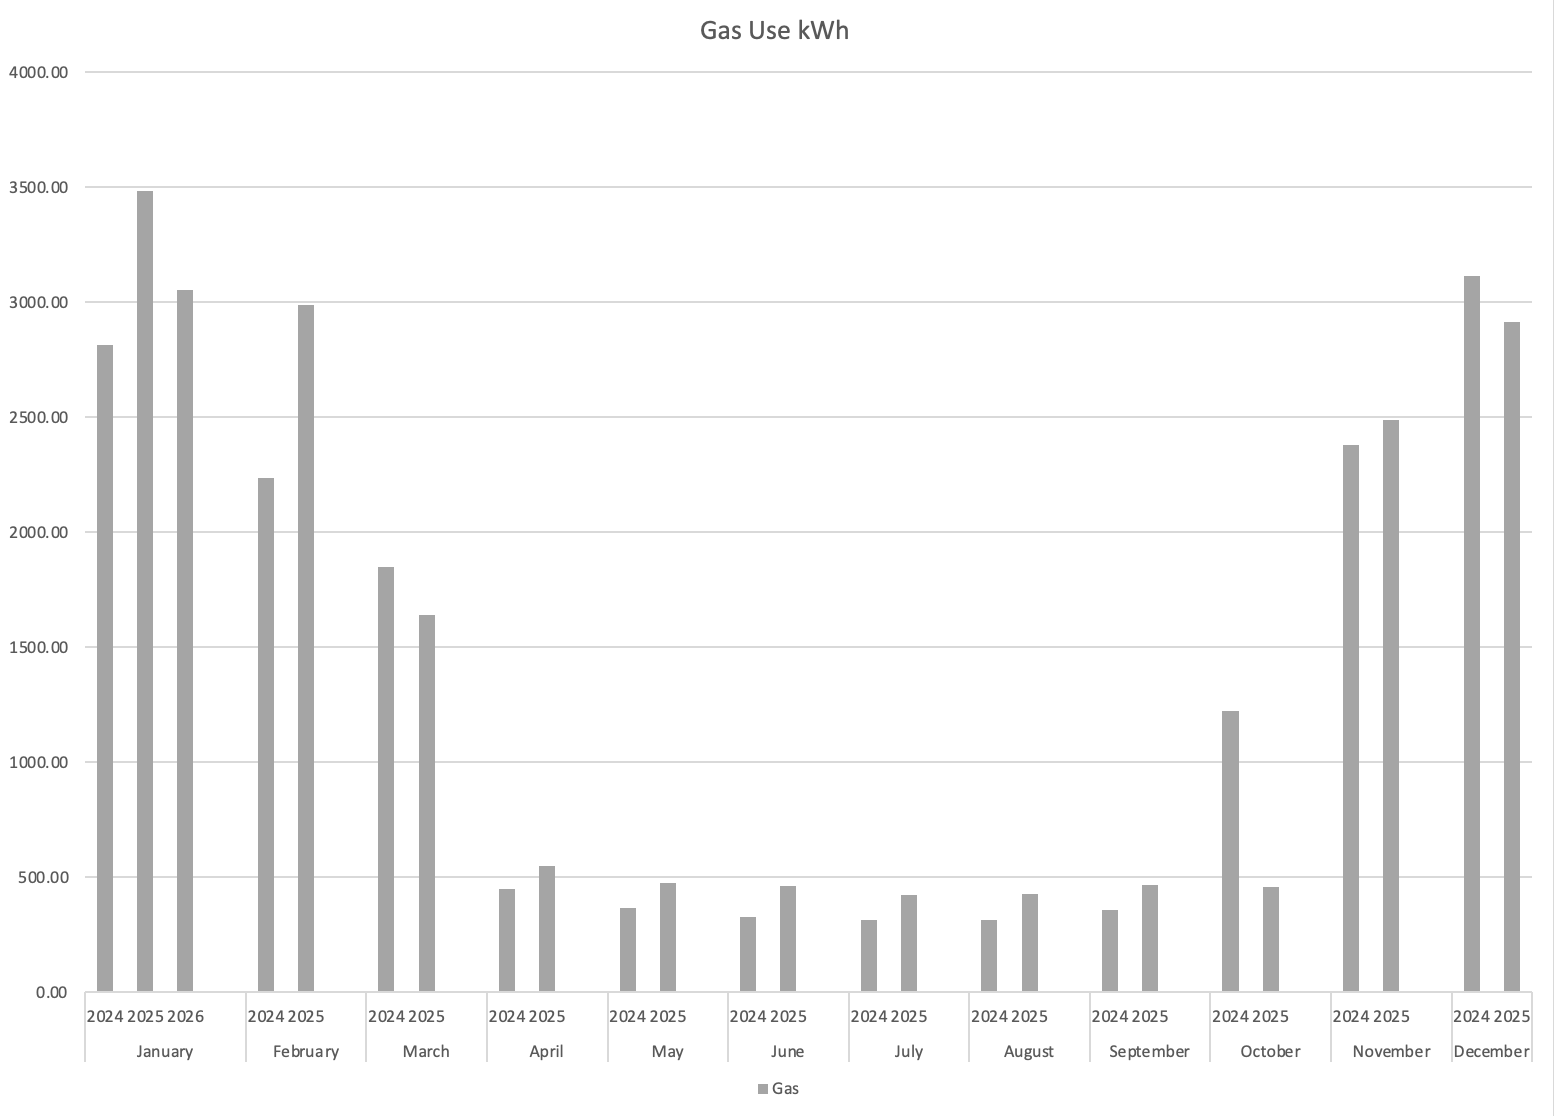
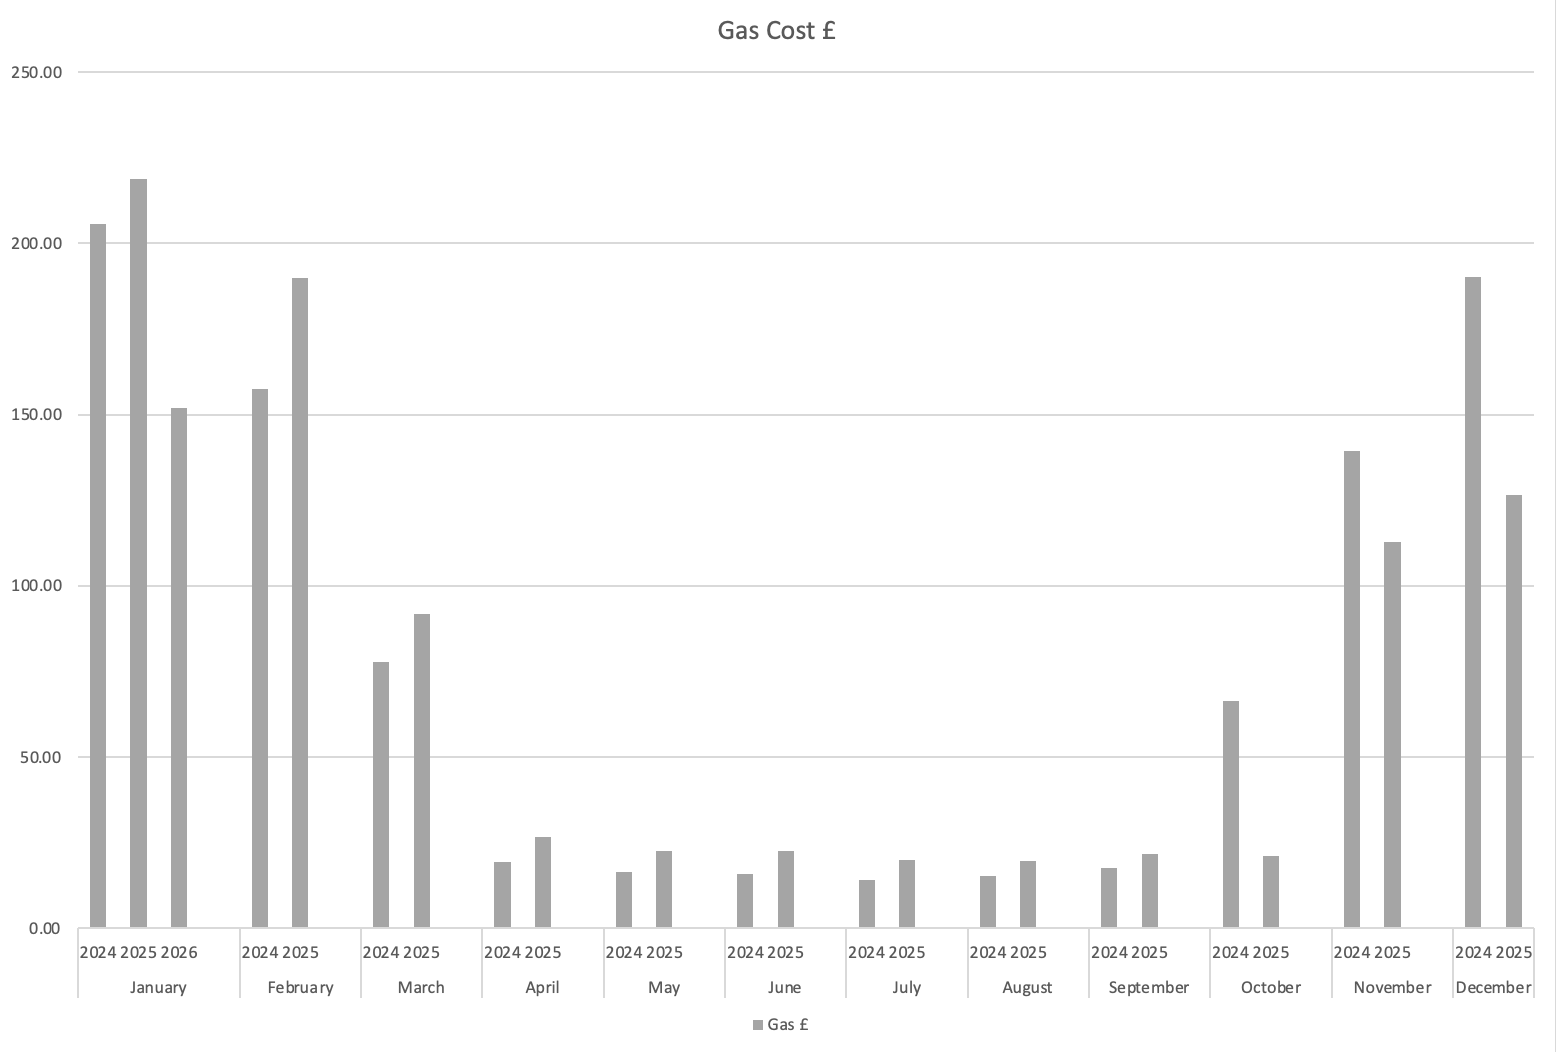
January Gas:
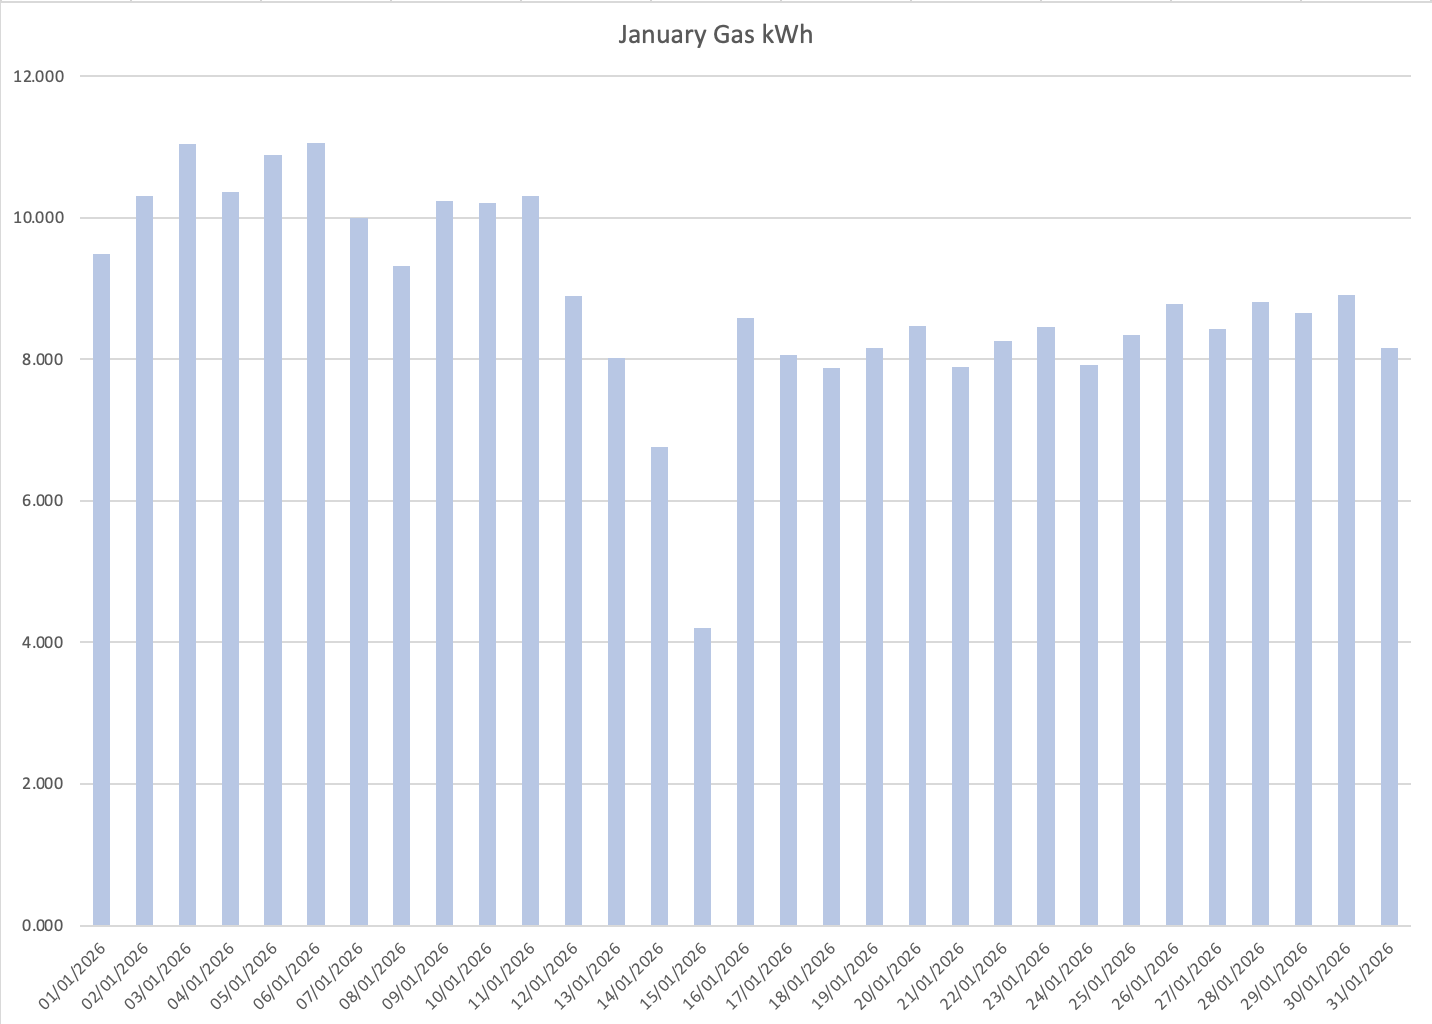
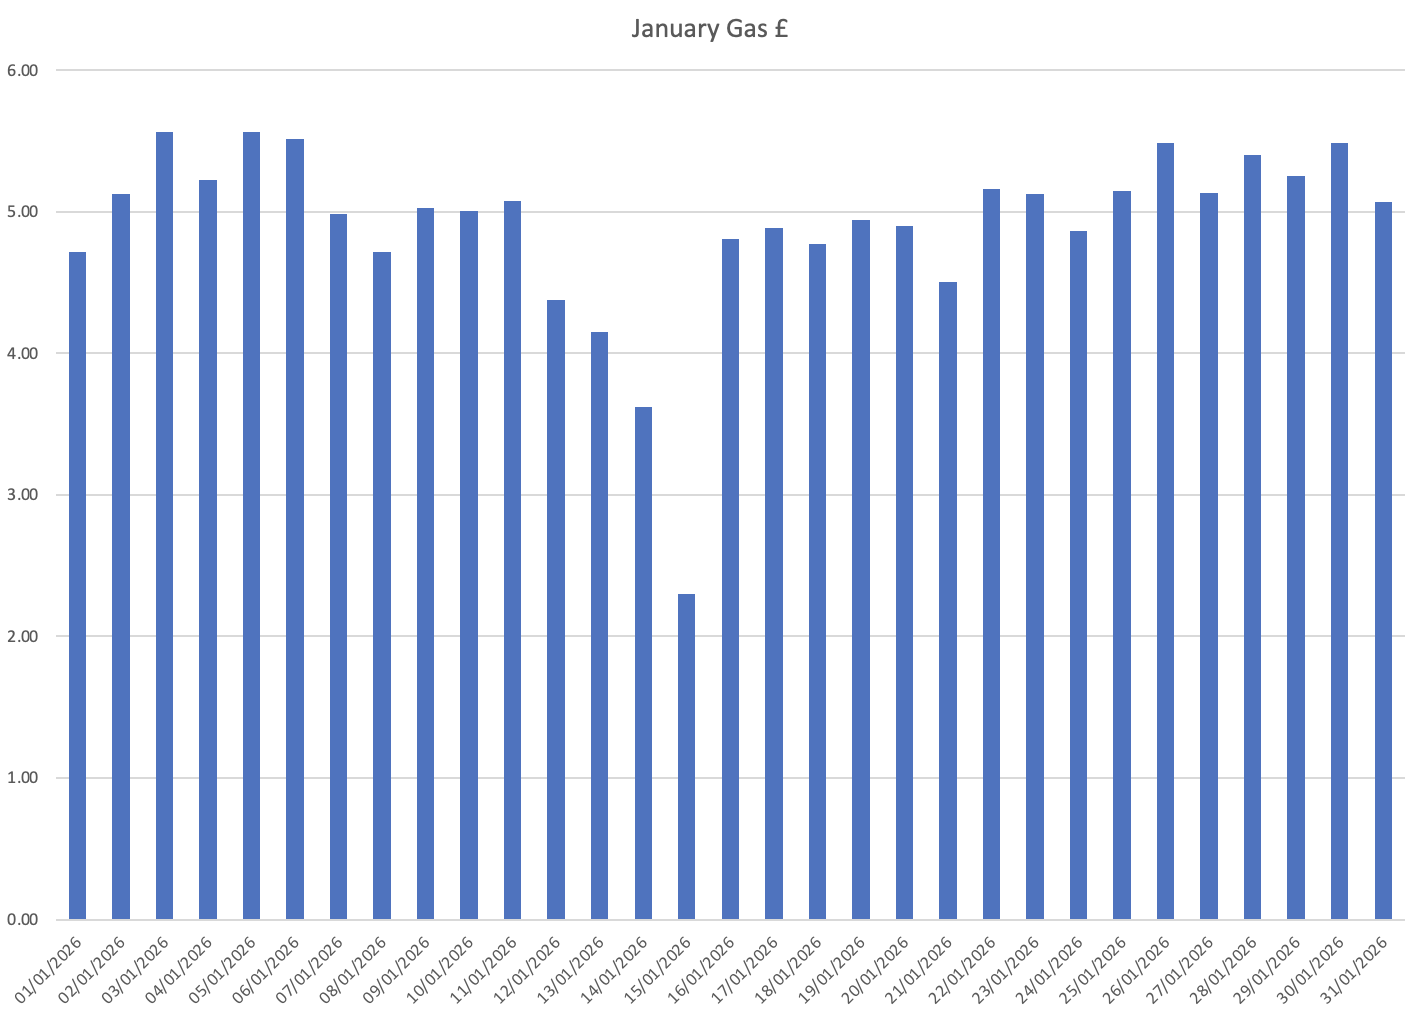
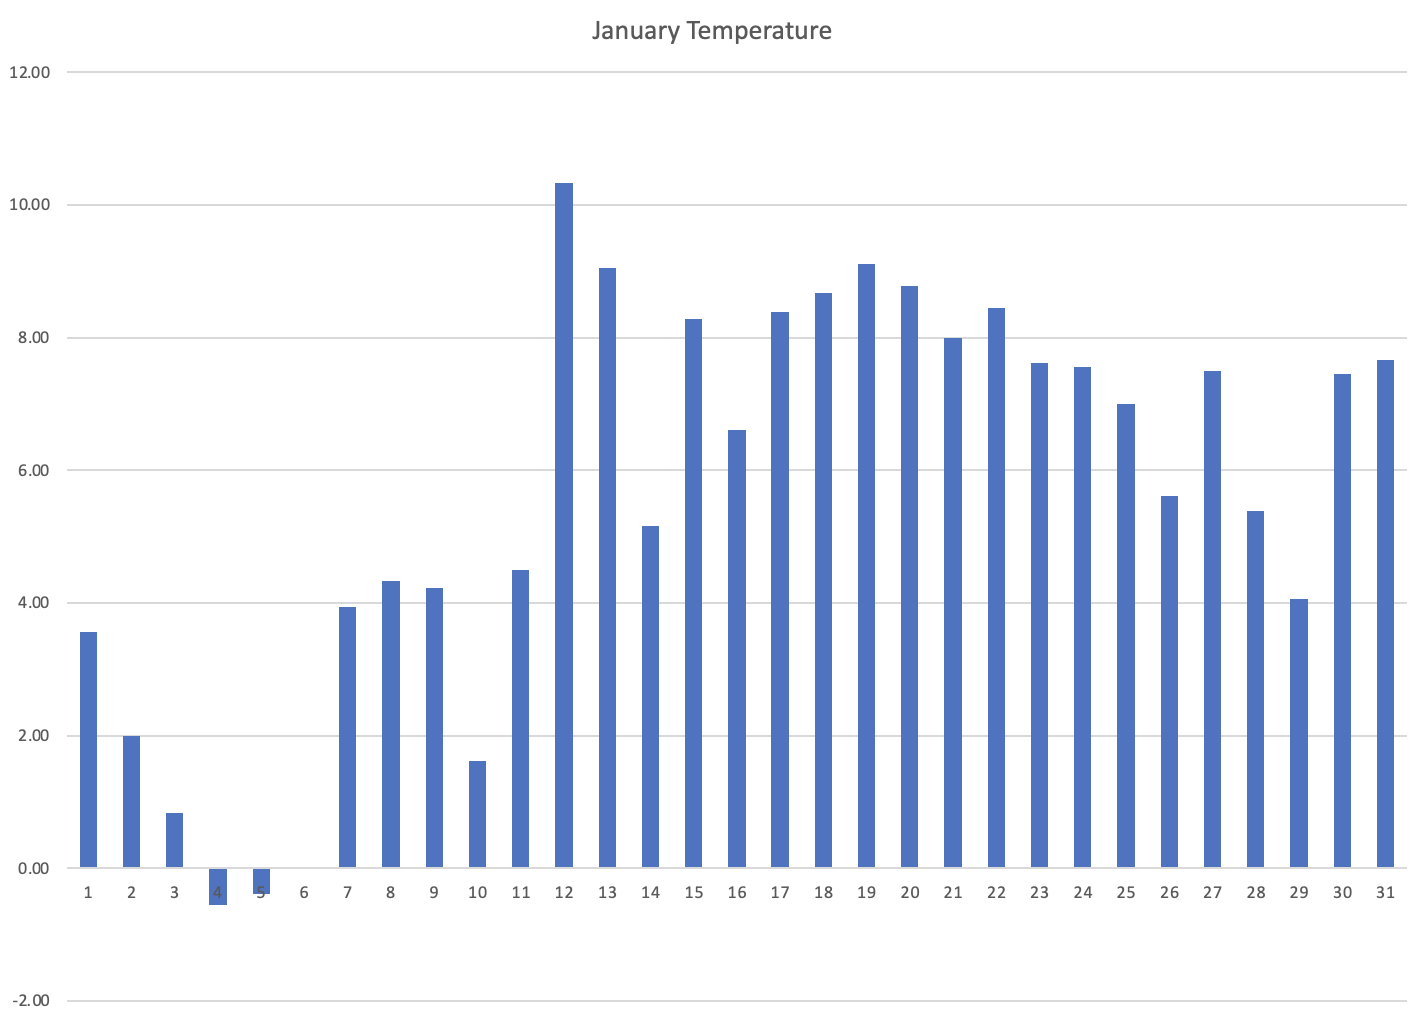
Overall a relatively mild January, my cost was down on last year, but so was my usage, and also the average cost per kWh was 0.0501 as compared to 0.0629 in 2025, so the lower cost per kWh had a bigger impact than my lower usage.
Gas costs: