This is the sixth full month with the solar being active.
Energy prices went up this month, peak electricity went up from £0.2439/kWh to £0.2672/kWh, off-peak electricity remained at £0.70/kWh and the standing charge went up from £0.4785/day to £0.4879/day.
October Electric:
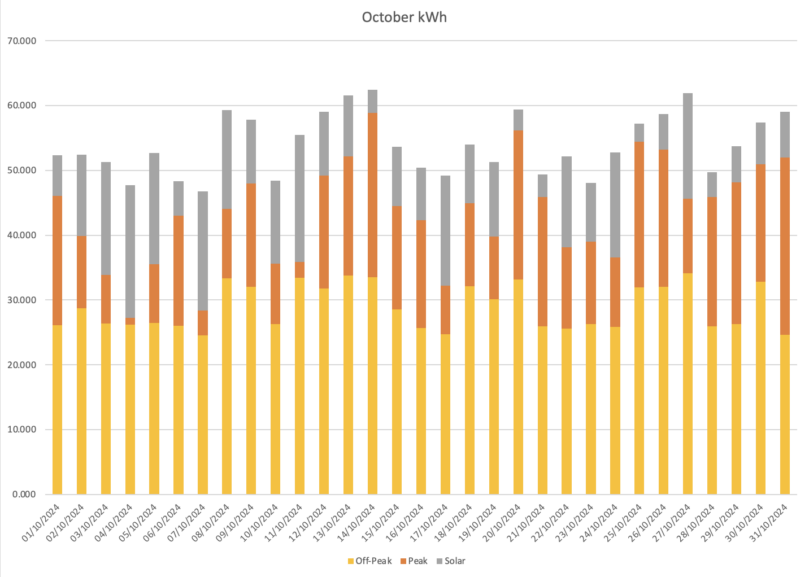
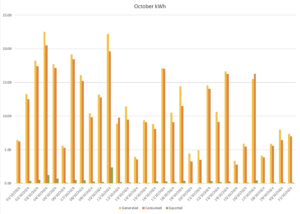
The average daily consumption, including solar, for the month of October was 53.98kWh, we have quite a large variation in solar production from a low of 3.36kWh up to a high of 22.51kWh.
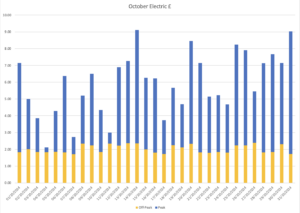
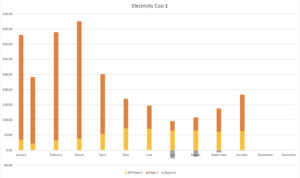
This in turn reflects quite visibly in the cost chart where we have a low of £0.28 and a high of £7.31 for peak electric usage.
It is easy to see from the Electricity cost graph which days were overcast/wet as they have much larger dark blue sections, the see-saw/sawtooth pattern for the Off-Peak is again largely due to whether or not the car was charged that night.
The average peak to off-peak percentage usage for the month was 32.04%, so not quite hitting the desired 25% or better reversal from pre solar, and skewed even more towards peak because of the bad weather.
Average usage: off-peak 28.86kWh, peak 14.60kWh, total 43.46kWh
Average costs: off-peak £2.02, peak £3.90, total £6.36 (including standing charge of £0.4557)
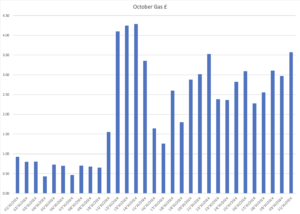
October Gas:
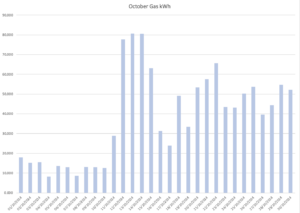
The gas was off for the some of the month, turned back on for 11-15, off again for 16-17 and then on again for the remainder of the month.
Highest gas usage was 80.595kWh and the lowest 8.192kWh – £4.52 and £0.71 respectively (including the standing charge of £0.2747).
Average usage: 39.45kWh, average gas tariff was £0.0539 – up by a penny or more on last month.
Average cost: £2.41 (including standing charge of £0.2747)
Total daily energy average cost for October: £8.77 (including standing charges of £0.7304).
Total costs for October were £62.62 off-peak, £120.94 peak, £74.794 gas, £271.88 overall (including standing charge of £22.95).
October 2023 costs were £50.26 off-peak, £395.40 peak, £32.45 gas, £491.03 overall (including standing charge of £20.82).
This is a 45% saving for compared to 2023!
October costs for 2024 using Dec 2023 E-ON tariffs £112.36 off-peak, £157.77 peak, £87.60 gas, £357.73 overall (including standing charge of £31.37).
So the practical saving was £84.55 vs staying on my old E-ON tariffs.
I also had my SEG tariff and was able to export a total of 10.70kWh of electricity at £0.15 per kWh for a total saving of £1.61.
Even worse than last month very few sunny days and lots of rain this month.
I will again use the same assumption as last month of 14.5kWh of battery, there no days where I carried battery charge to the next day.
So for this month, I have 31 days of solar production which means 14.5kWh x 31 days = 449.50kWh for the batteries that need to ‘swap’ from off-peak to peak rate.
I then produced 350.58kWh of solar, 10.70kWh of which was given back to the grid.
This means that the additional savings for having solar and batteries are (350.58kWh * (£0.2672 – £0.070)) + ((350.58-10.70)kWh) * £0.2672), = (350.58kWh * £0.1972) + (339.88kWh * £0.2672) = £88.62 + £90.80 = £179.43
Which in effect means that I have saved £179.43 + £84.55 + £1.61 = £265.58 compared to my old E-ON tariff and no solar/batteries for the month of October.
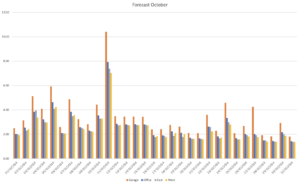
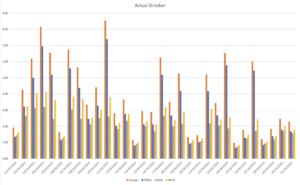
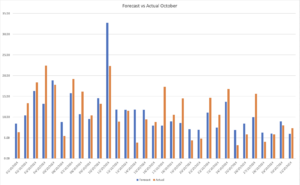
These are the graphs of forecast vs actual production:
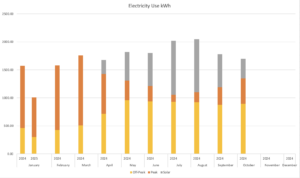
Month on month usage and cost graphs for 2024 (including exports) for Electricity:
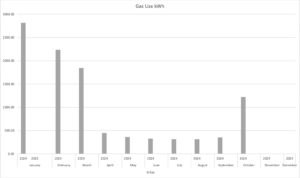
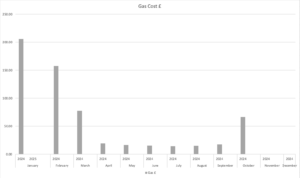
and the same for Gas:
Slightly up, as expected with turning the heating on and lower levels of sun.
Current savings to date vs my old E-ON tariff is £2,240.73.
