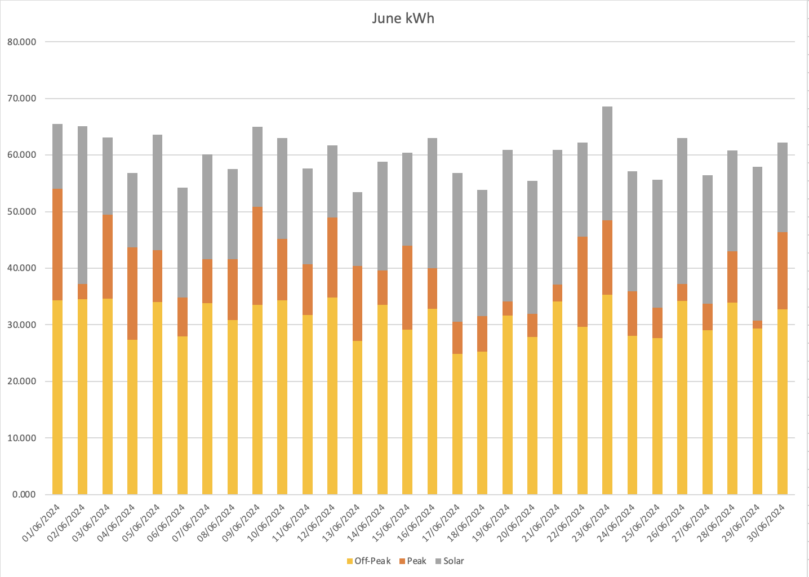
This is the second full month with the solar being active.
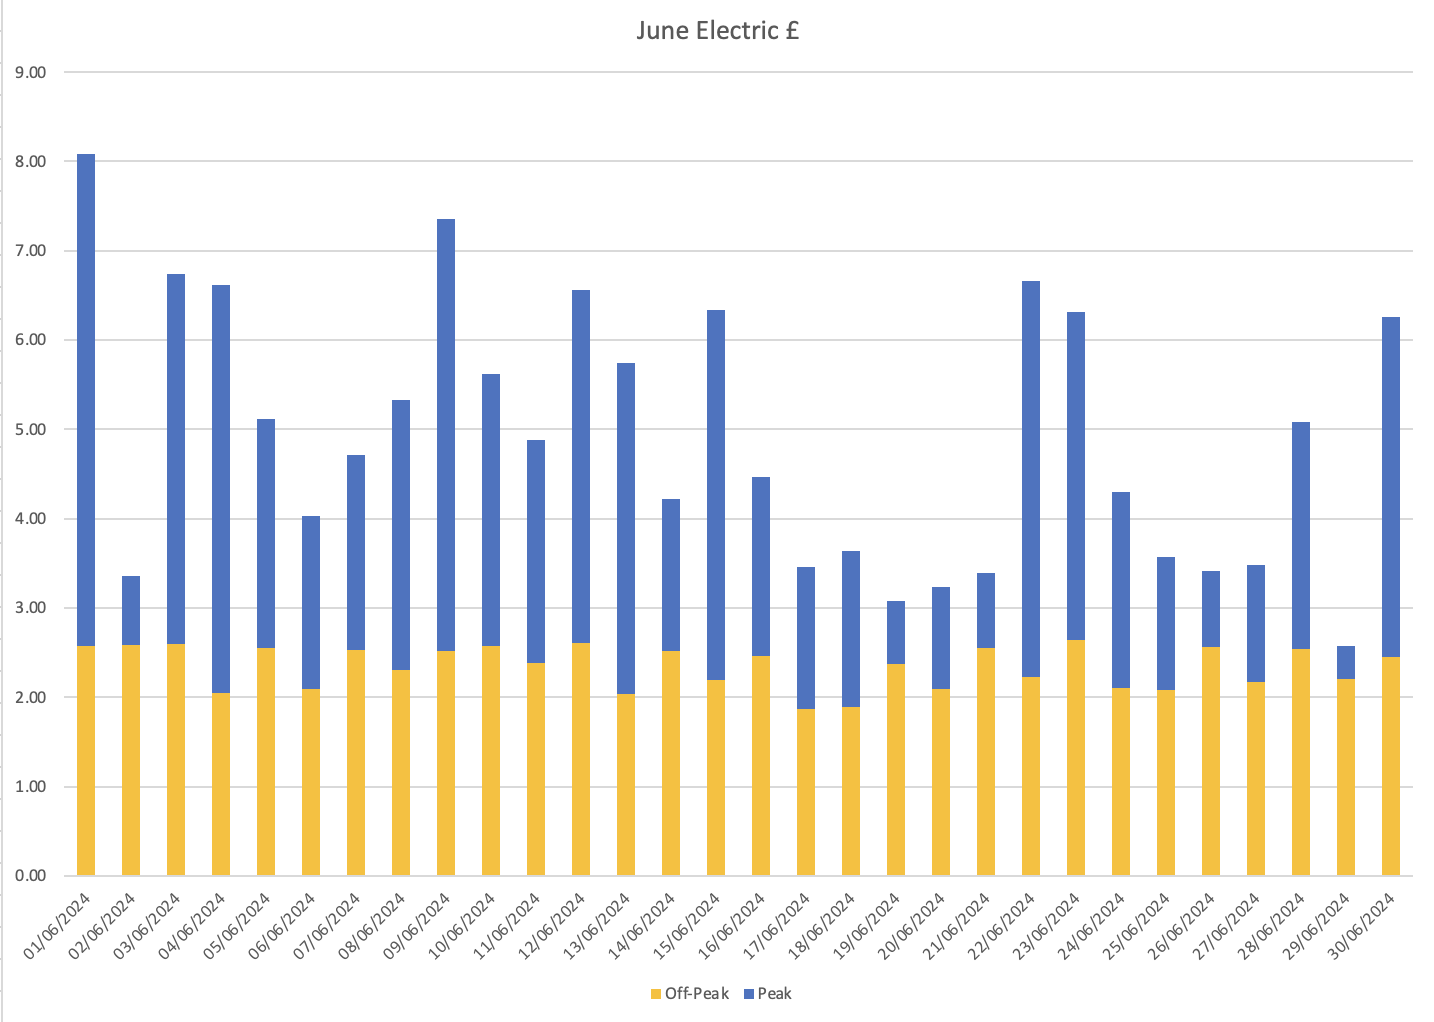
Peak and off-peak electricity prices remained the same as last two months.
June Electric
The average daily consumption, including solar, for the month of June was 59.21kWh, we had slightly less variation in solar production from a low of 11.49kWh up to a high of 27.17kWh.
This in turn reflects quite visibly in the cost chart where we have a low of £0.37 and a high of £5.50 for peak electric usage.
The average peak to off-peak percentage usage for the month was 21.66%, so maintaining the desired 25% or better reversal from pre solar.
Average usage: off-peak 31.27kWh, peak 9.22kWh, total 40.49kWh
Average costs: off-peak £2.35, peak £2.58, total £5.38 (including standing charge of £0.4557)
June Gas
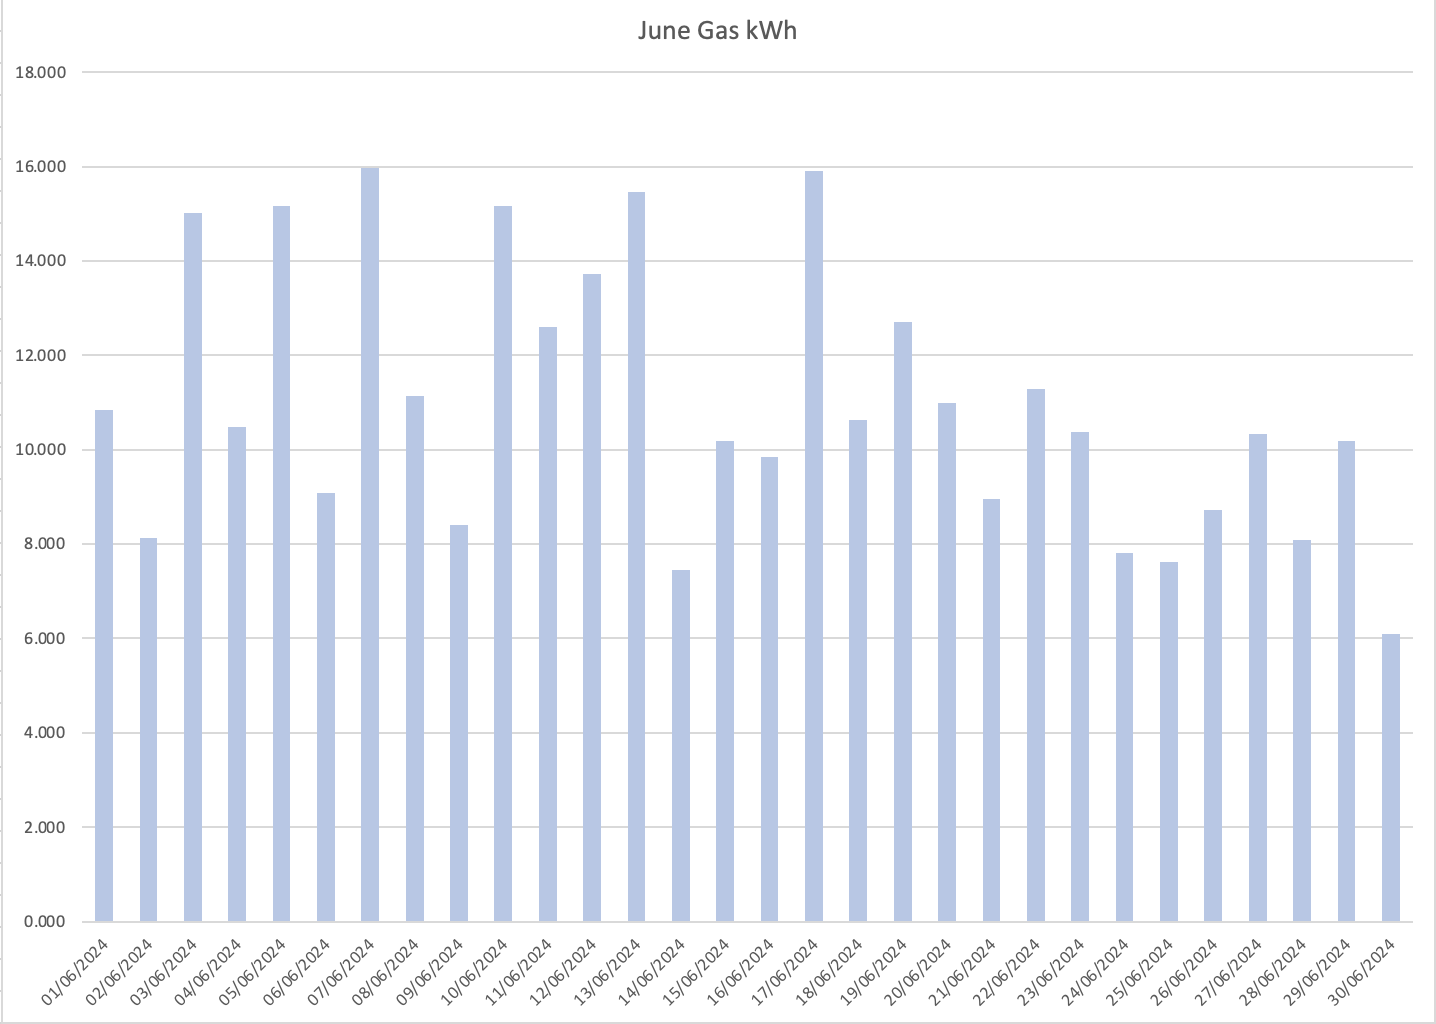
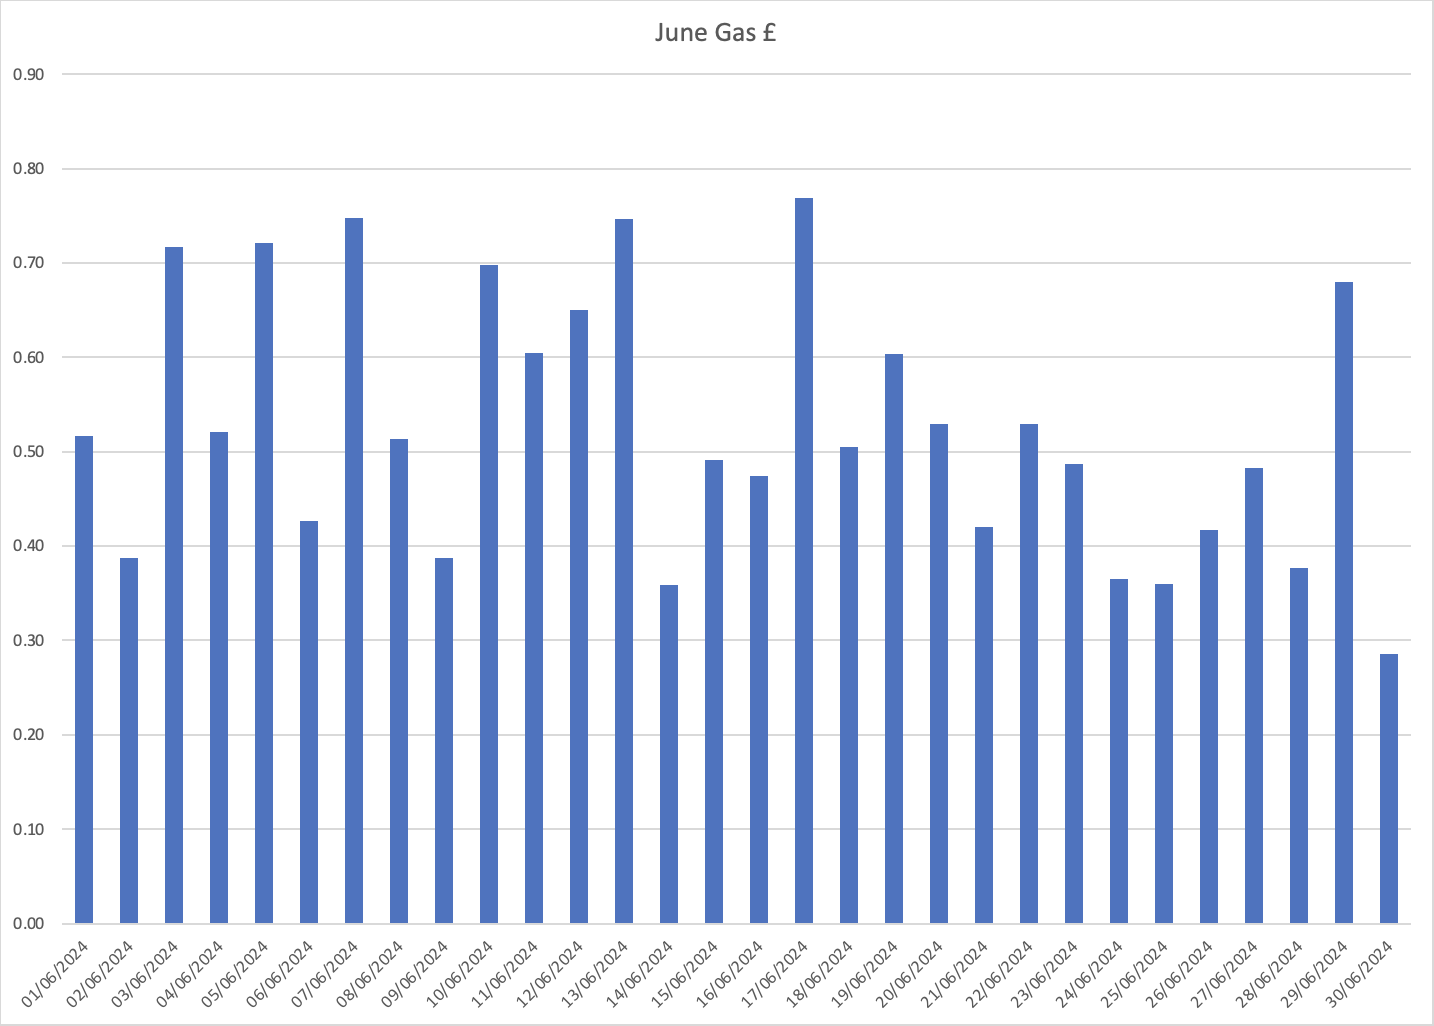
Once again the gas was off for the entire month, highest gas usage was 15.4kWh and the lowest 6.1Wh – £0.72 and £0.29 respectively (including the standing charge of £0.2747).
Average usage: 10.94kWh
Average cost: £0.53 (including standing charge of £0.2747)
Total daily energy average cost for June: £6.18 (including standing charges of £0.6948).
Total costs for June were £70.36 off-peak, £77.28 peak, £15.77 gas, £185.32 overall (including standing charge of £21.91).
June 2023 costs were £42.74 off-peak, £397.13 peak, £86.46 gas, £538.83 overall (including standing charge of £20.82).
Nearly a 65% saving compared to 2023!
May costs for 2024 using Dec 2023 E-ON tariffs £117.83 off-peak, £96.33 peak, £29.53 gas, £243.69 overall (including standing charge of £20.82).
So the practical saving was £57.68 vs staying on my old E-ON tariffs.
I will again use the same assumption as last month of 14.5kWh of battery, as there were no days where I carried any battery charge to the next day.
So for this month, I have 30 days of solar production which means 14.5kWh x 30 days = 435kWh for the batteries that need to ‘swap’ from off-peak to peak rate.
I then produced 586kWh of solar, no significant amount of which was given back to the grid.
This means that the additional savings for having solar and batteries are (435kWh * (£0.2794 – £0.075)) + (586kWh * £0.2794), = (435kWh * £0.2044) + (586kWh * £0.2794) = £88.91 + £163.73 = £252.64
Which in effect means that I have saved £252.64 + £57.68 = £310.32 compared to my old E-ON tariff and no solar/batteries for the month of June.
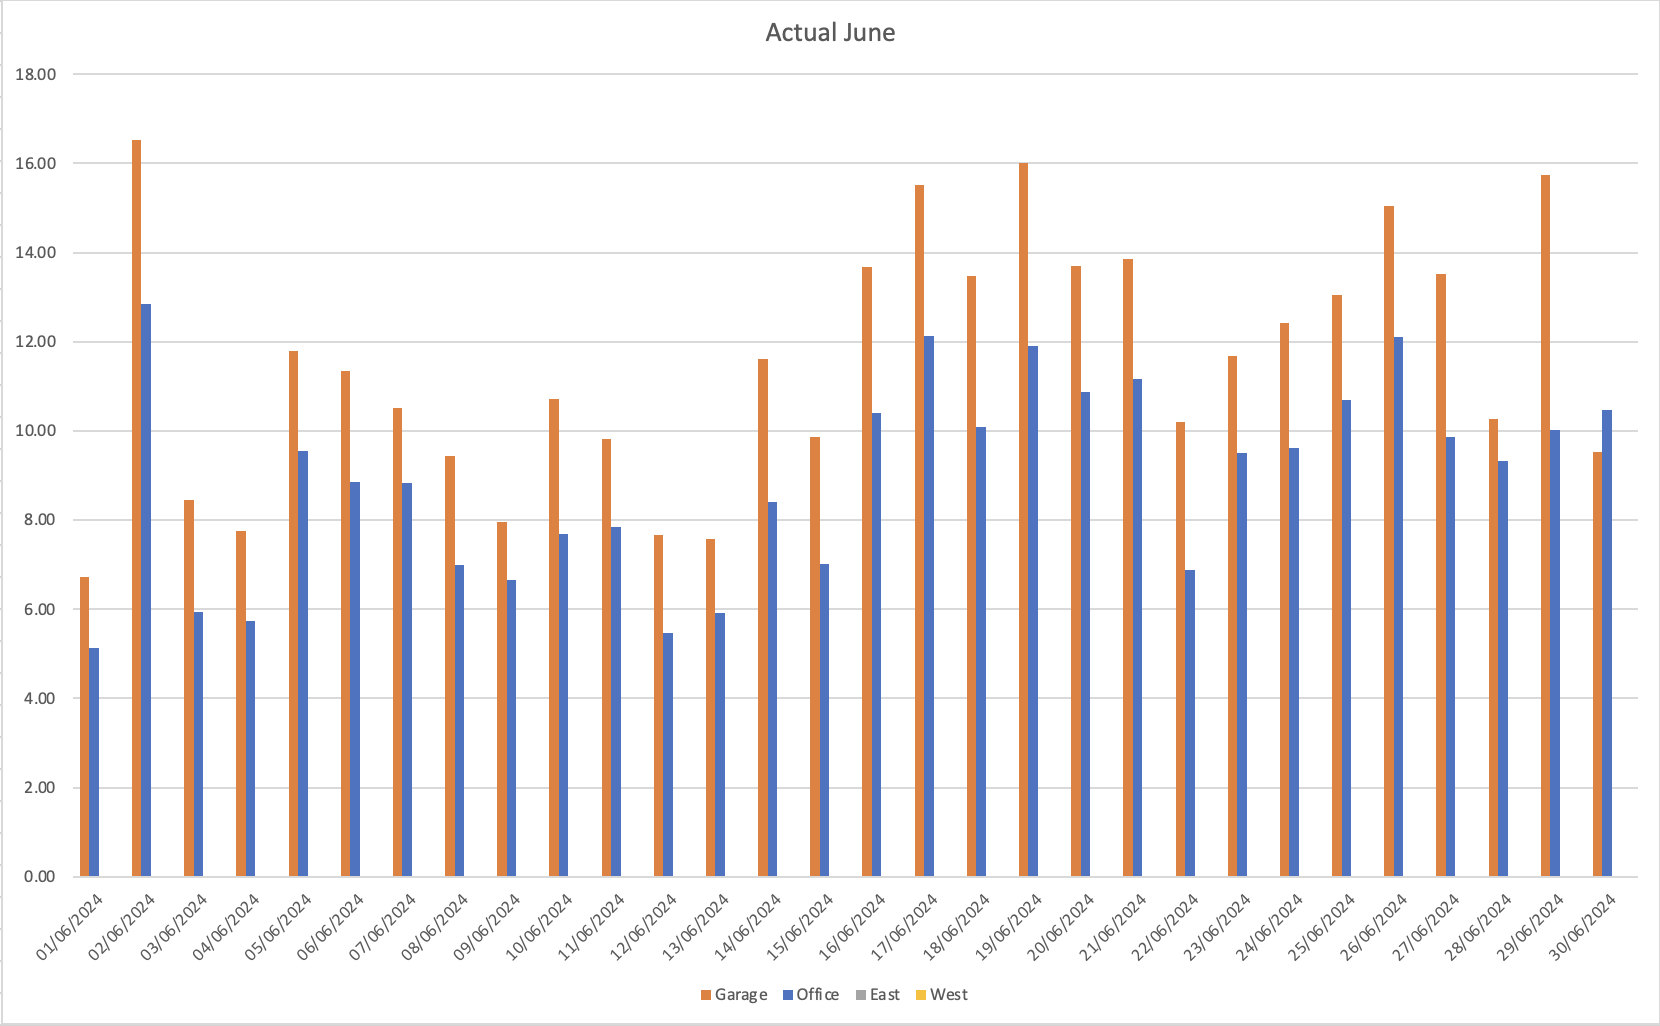
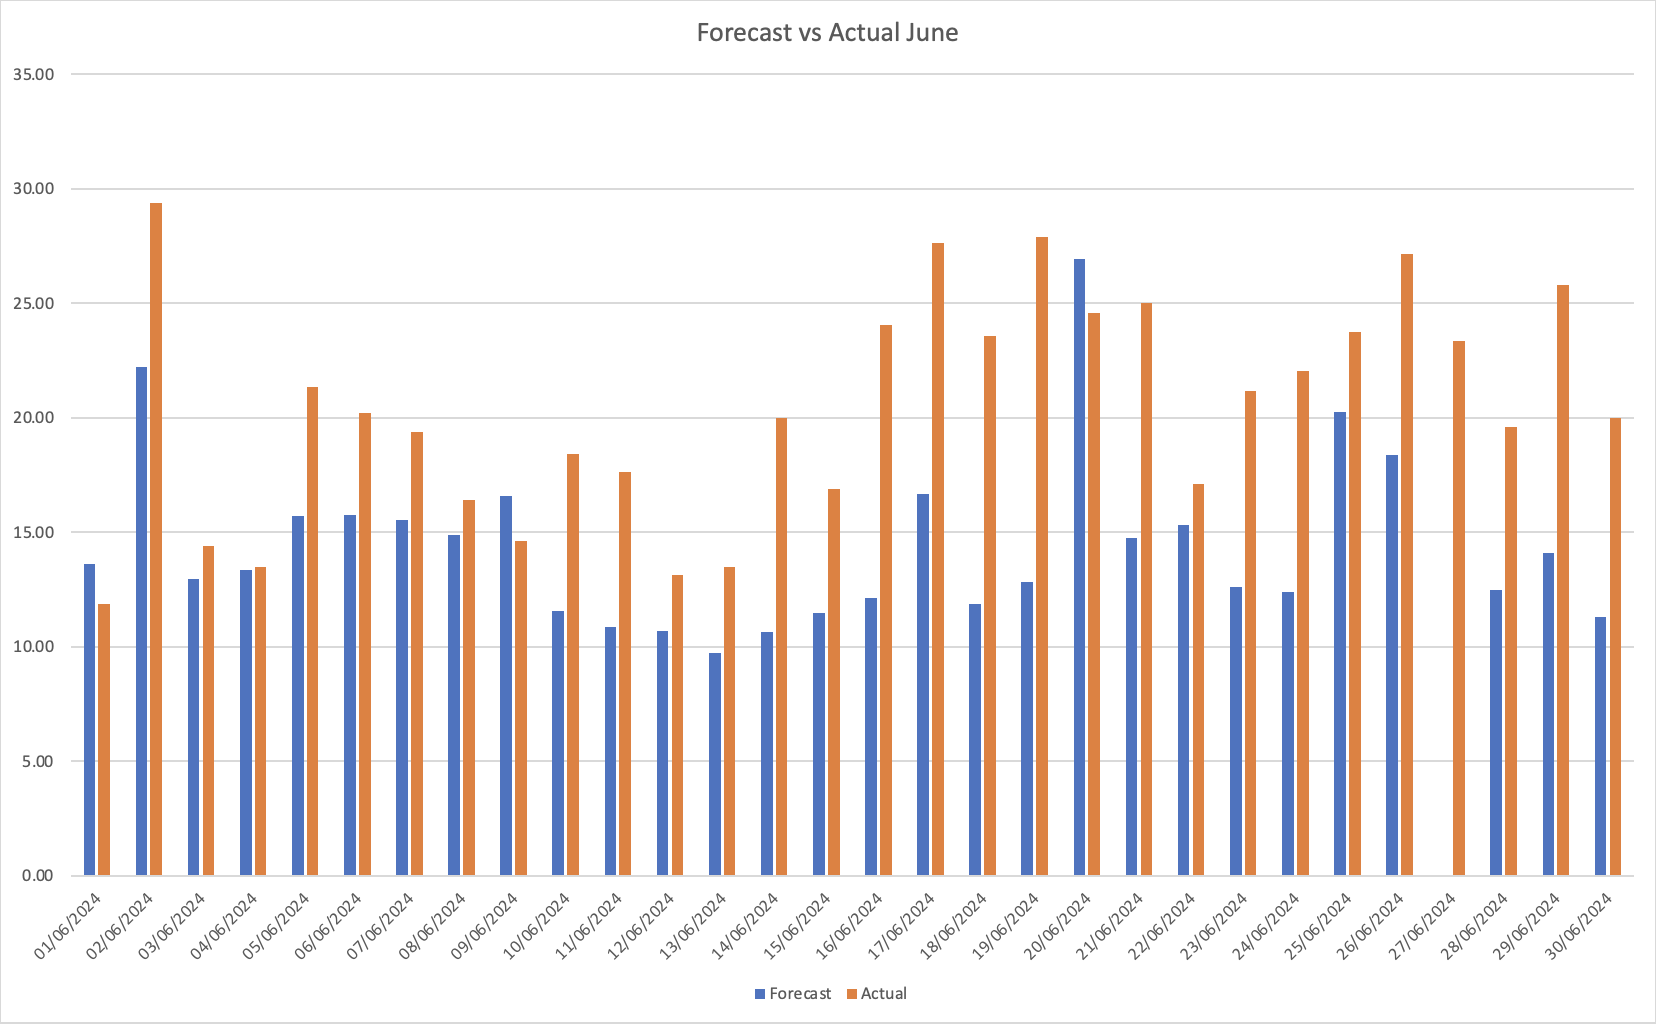
These are the graphs of forecast vs actual production:
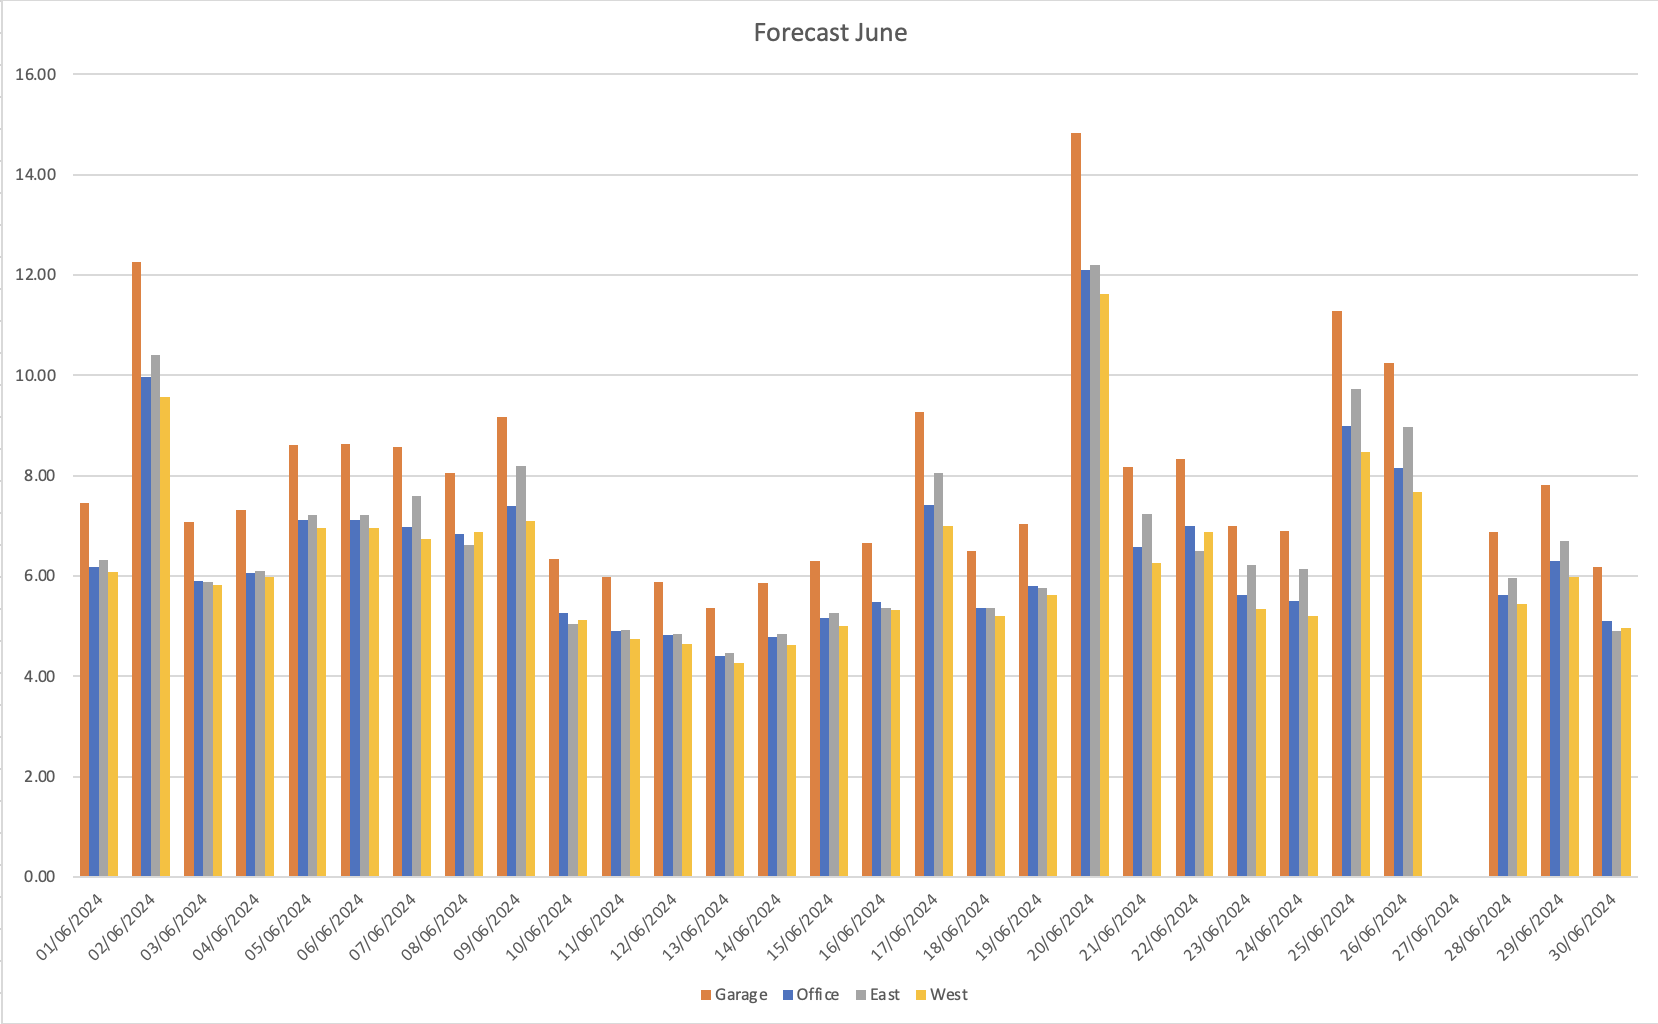
The first graph shows forecasted production for each of the 4 arrays, garage, office, east and west, I have still not installed the east or west array, but I am capturing the forecast data in readiness.
The Actual production data is shown for the garage and office arrays in the middle graph and then forecast compared to actual in the third graph for just these two arrays.
On sunny days I am still massively exceeding the forecast, dull days, I either match or am slightly behind the forecast.
For some reason, my forecast data was empty for 27th June, hence the gap in the charts.