This is my second year with Octopus Energy, and the only significant changes I have made was adding a fourth Enphase battery at the end of April and few additional plug in batteries at the end of November.
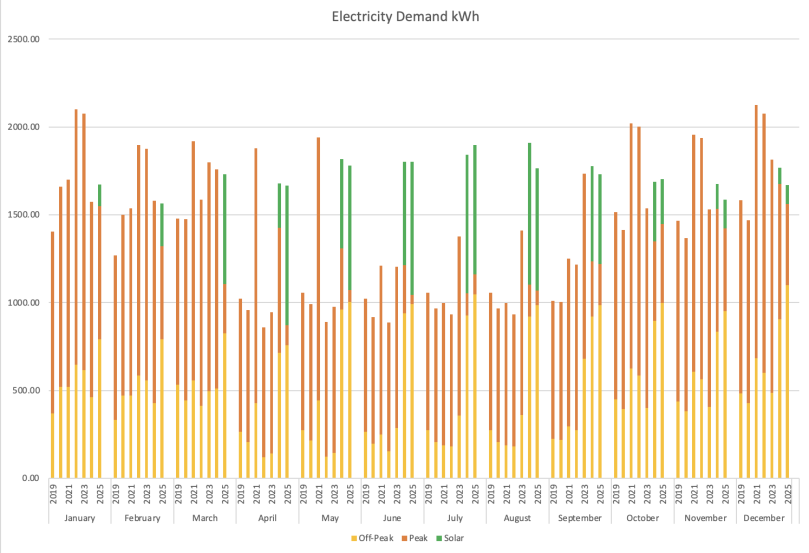
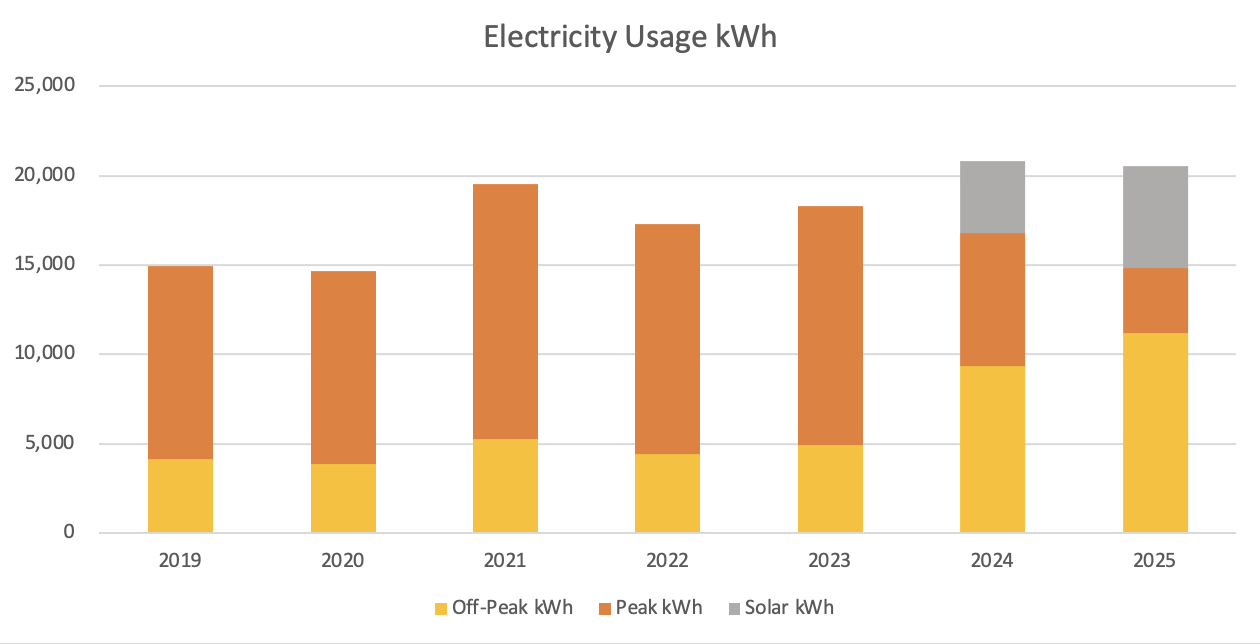
This first graph shows my electricity demand by year broken down by source (off-peak, peak and solar).

My usage has largely remained the same for this year, however much more was supplied via solar and the peak vs off-peak has also improved.
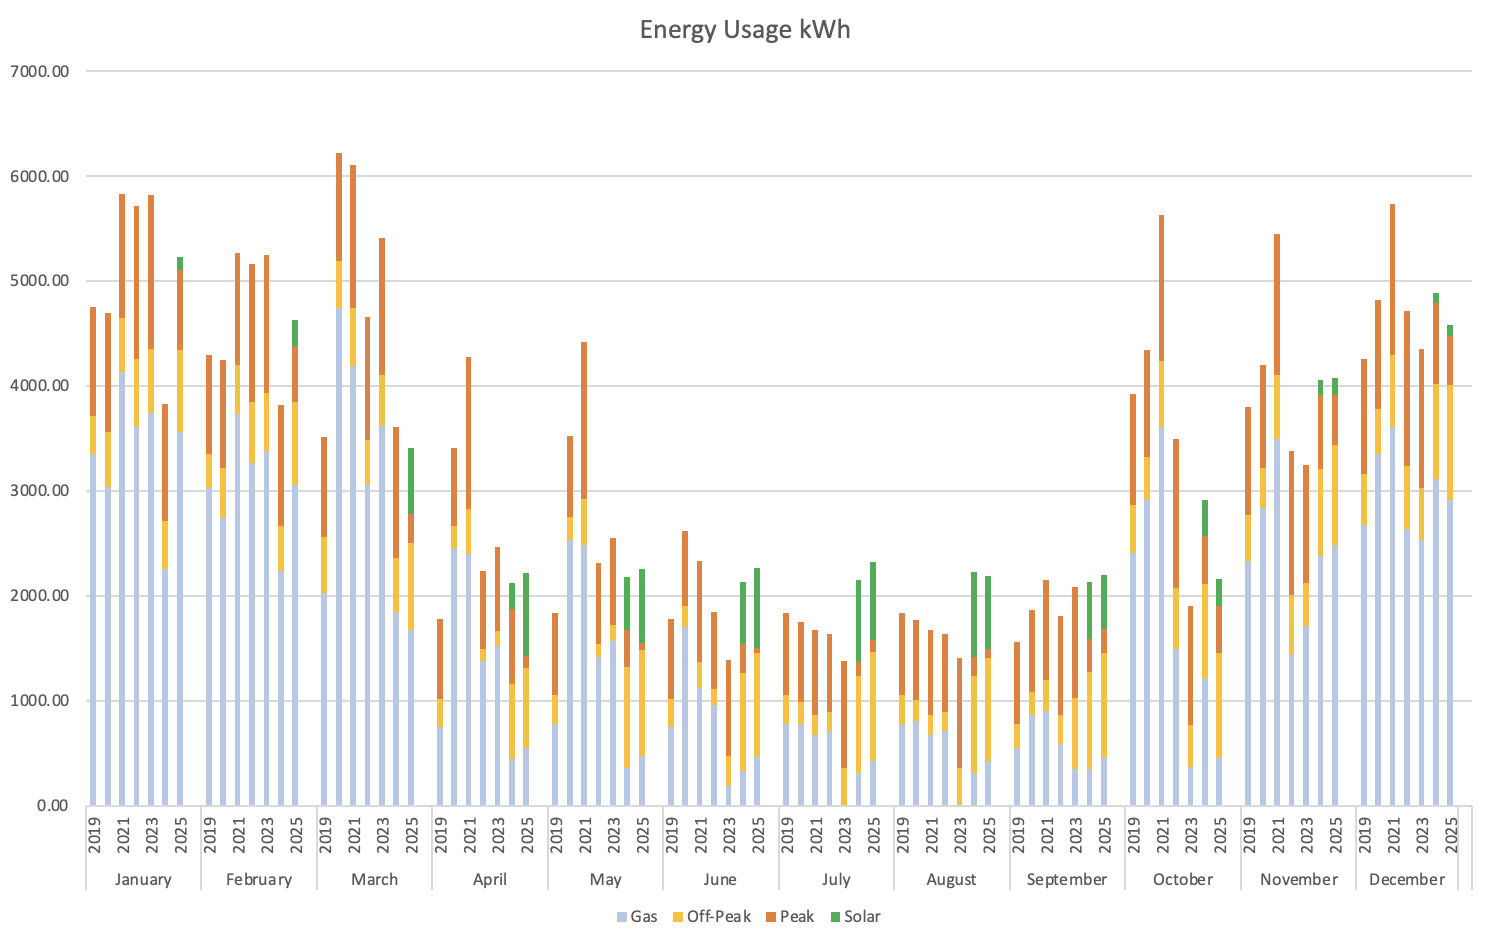
This next graph shows total energy usage, including gas for the same set of years (2019-2025).
I then have a breakdown of each usage type by year
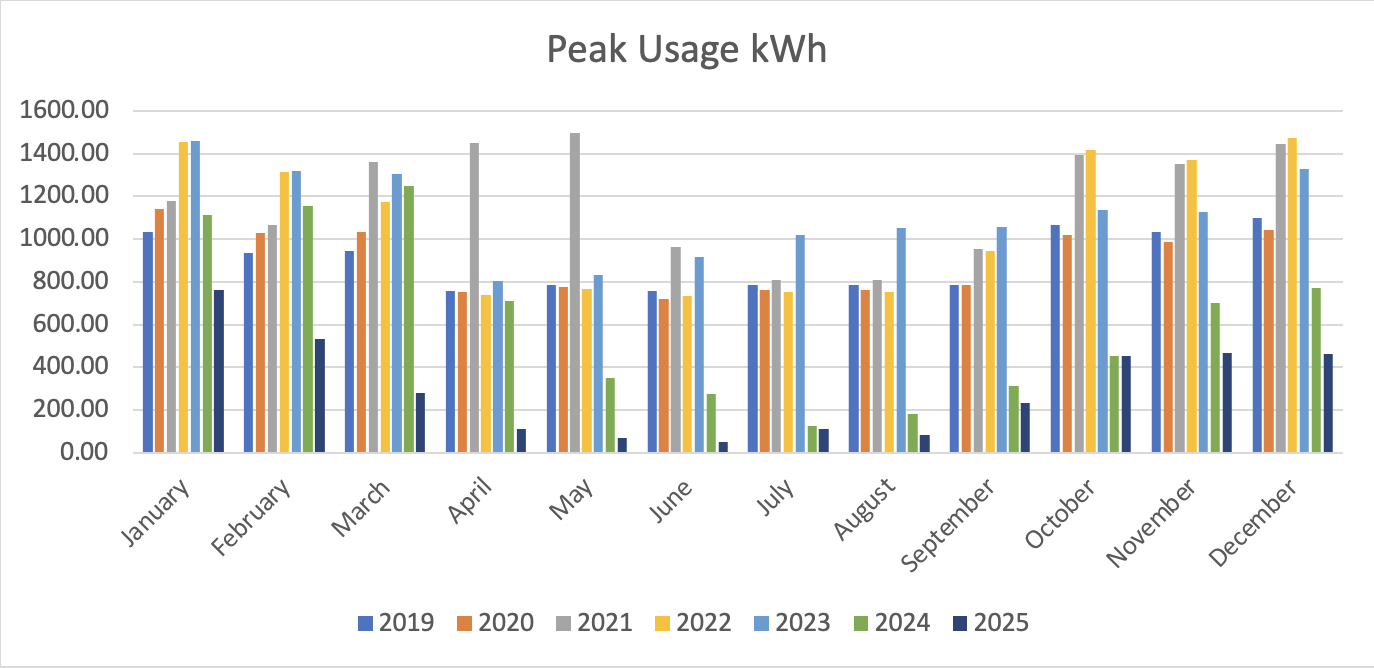
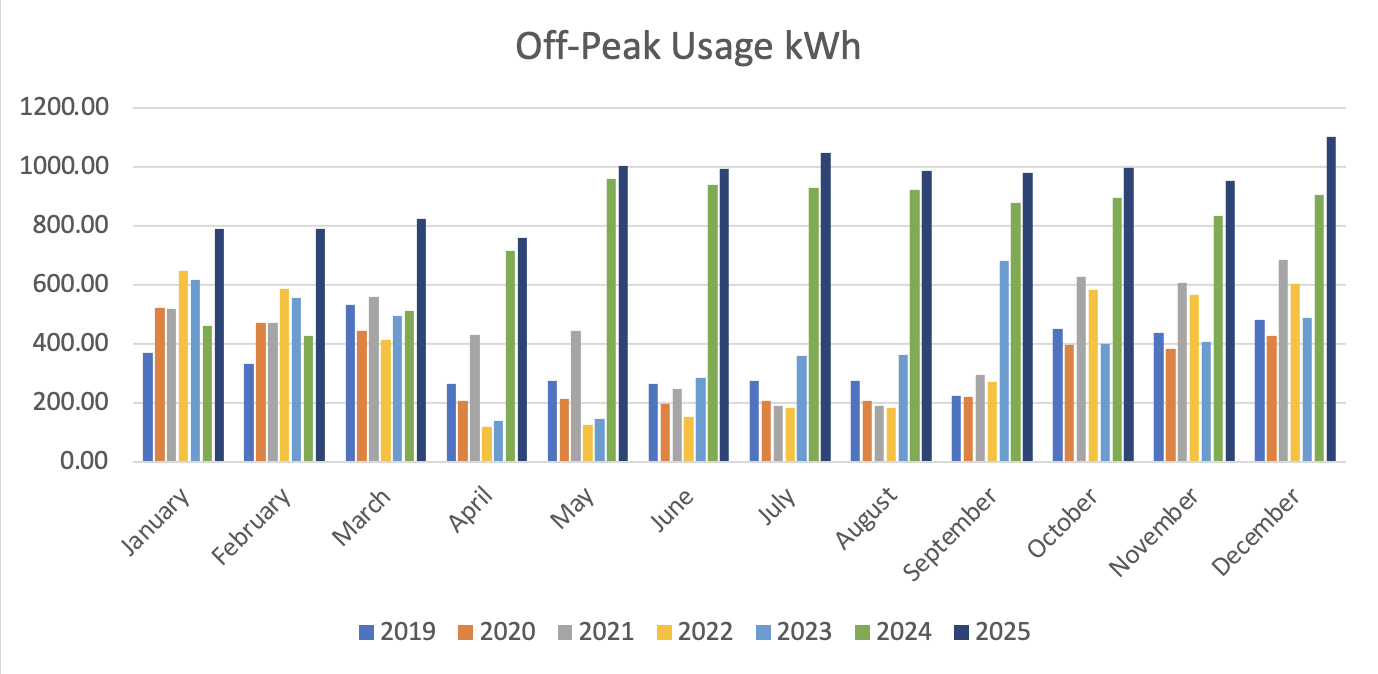
The shift from peak to off-peak can clearly be seen by the much smaller lines in the peak graph and taller lines in the off-peak graph.
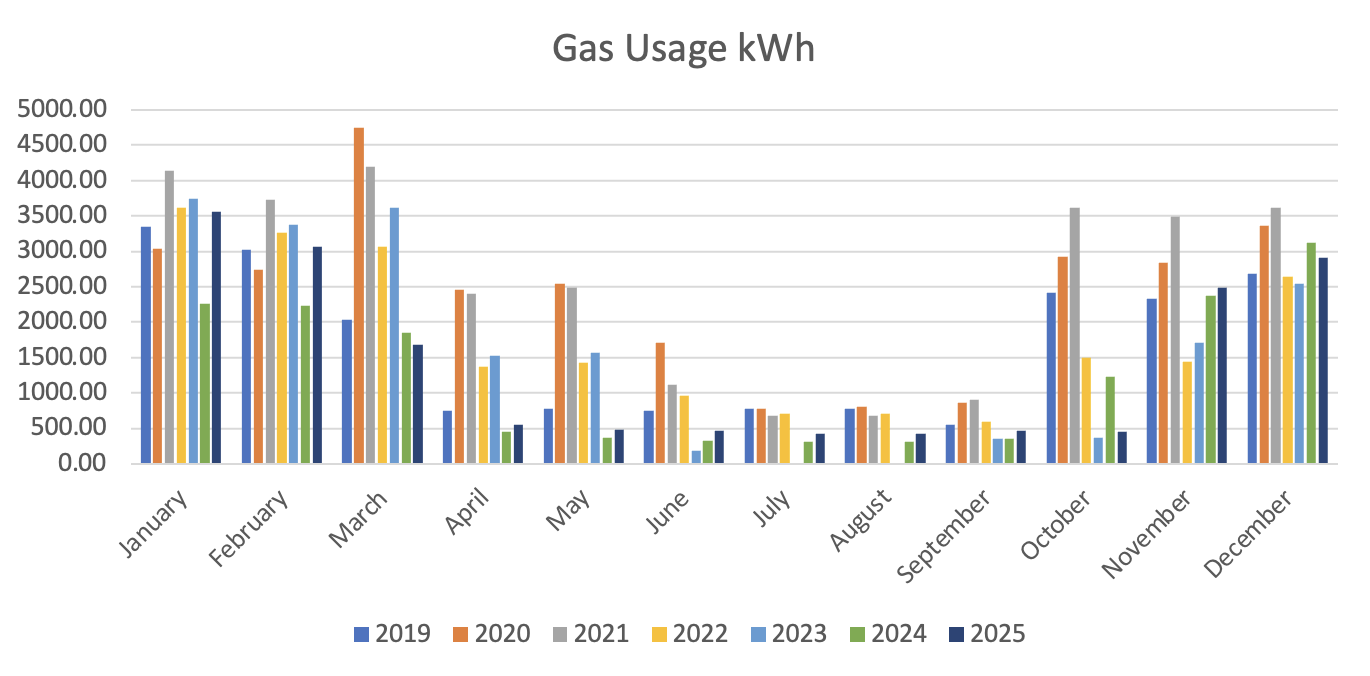
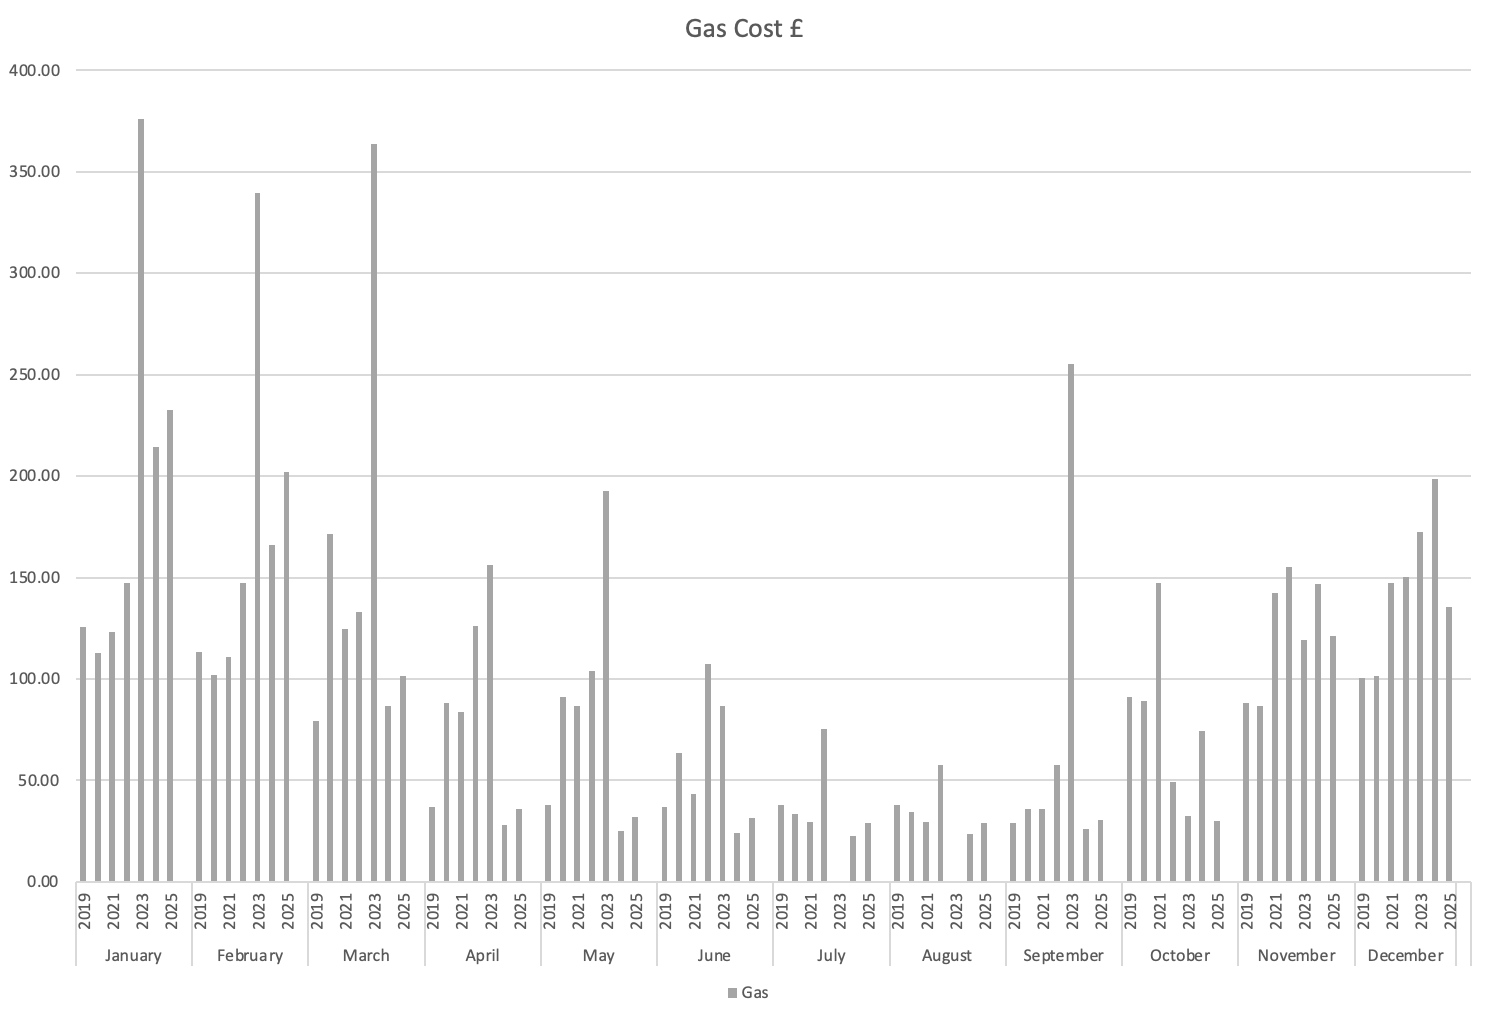
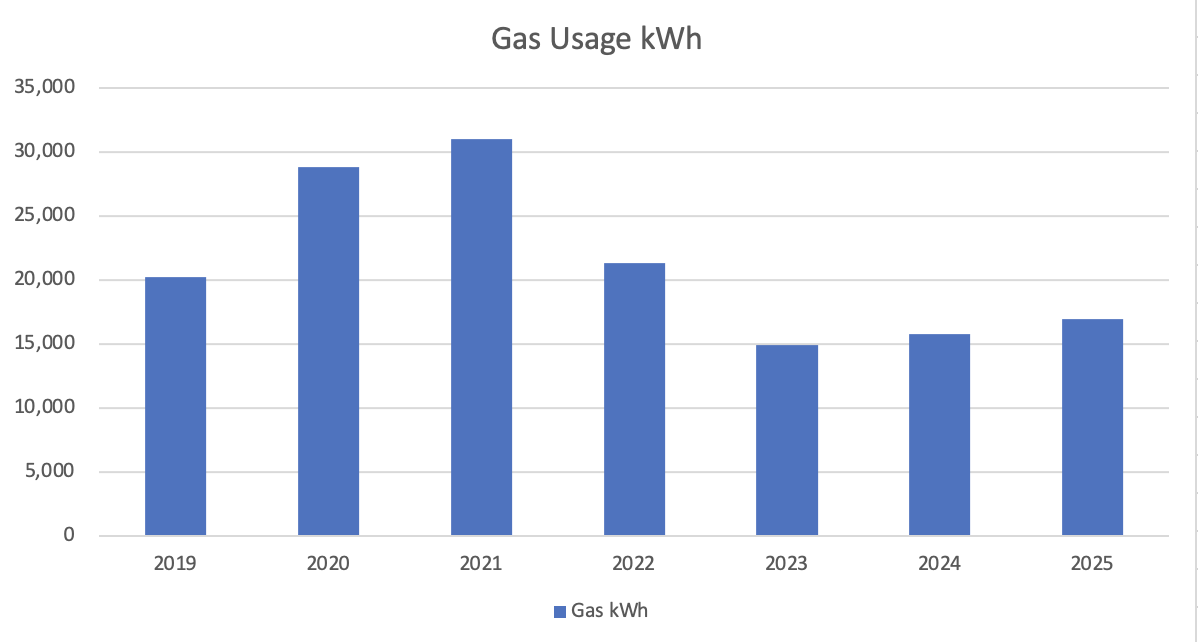
Gas usage is entirely dependent on the weather conditions, as more gas is used if it is colder and less, or at least only that required for hot water in the warmer months.
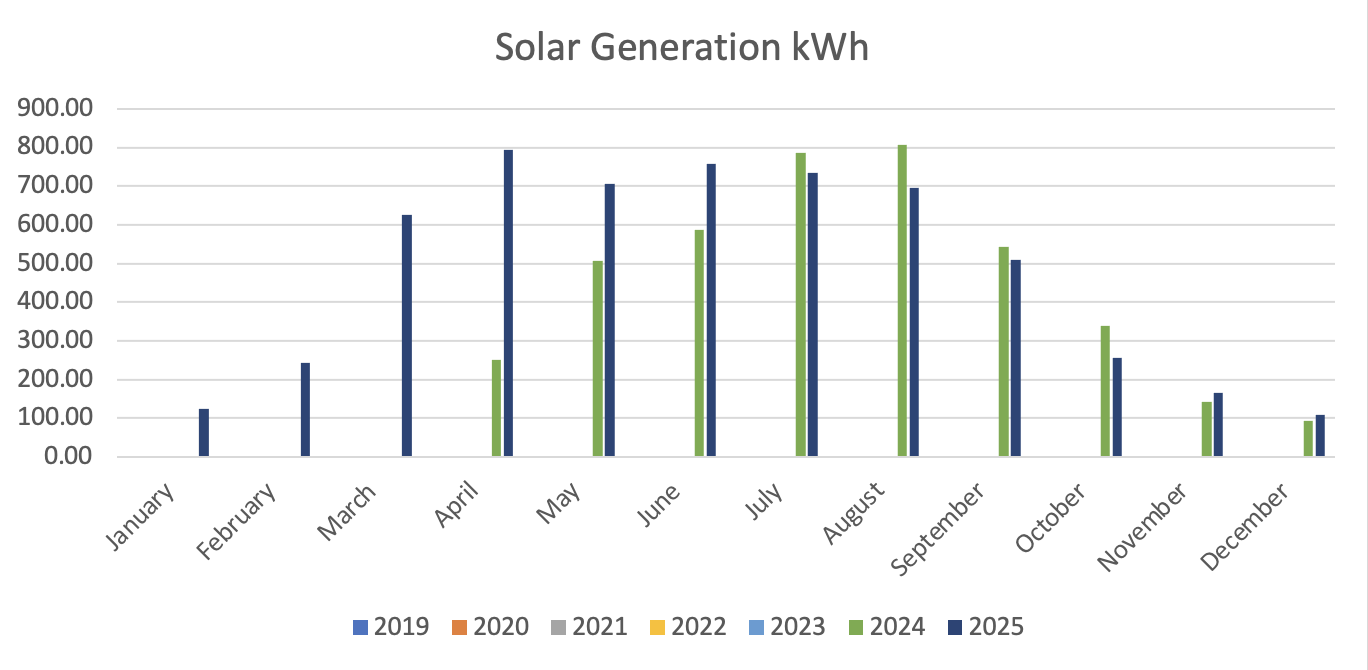
Solar production obviously helped a lot in the months where the sun was shining, not so much in the autumn and winter months.
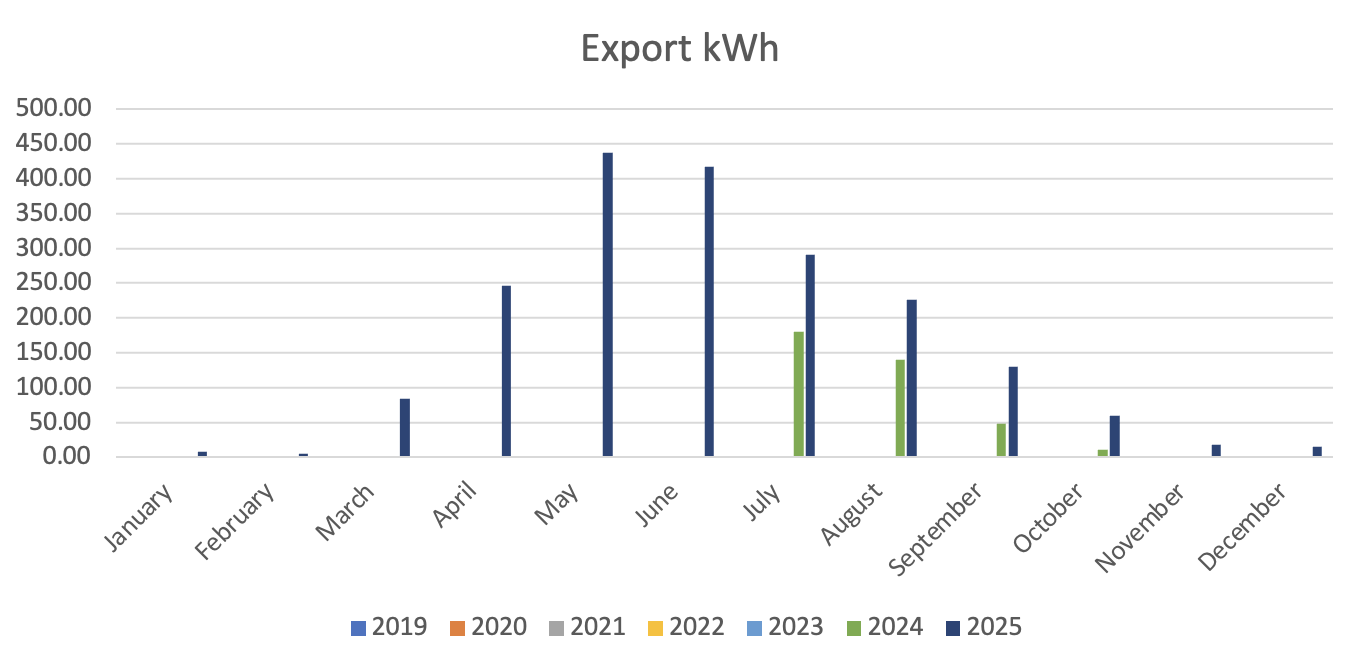
Export contributed a fair amount this year as it happened to be particularly sunny especially in the earlier months.
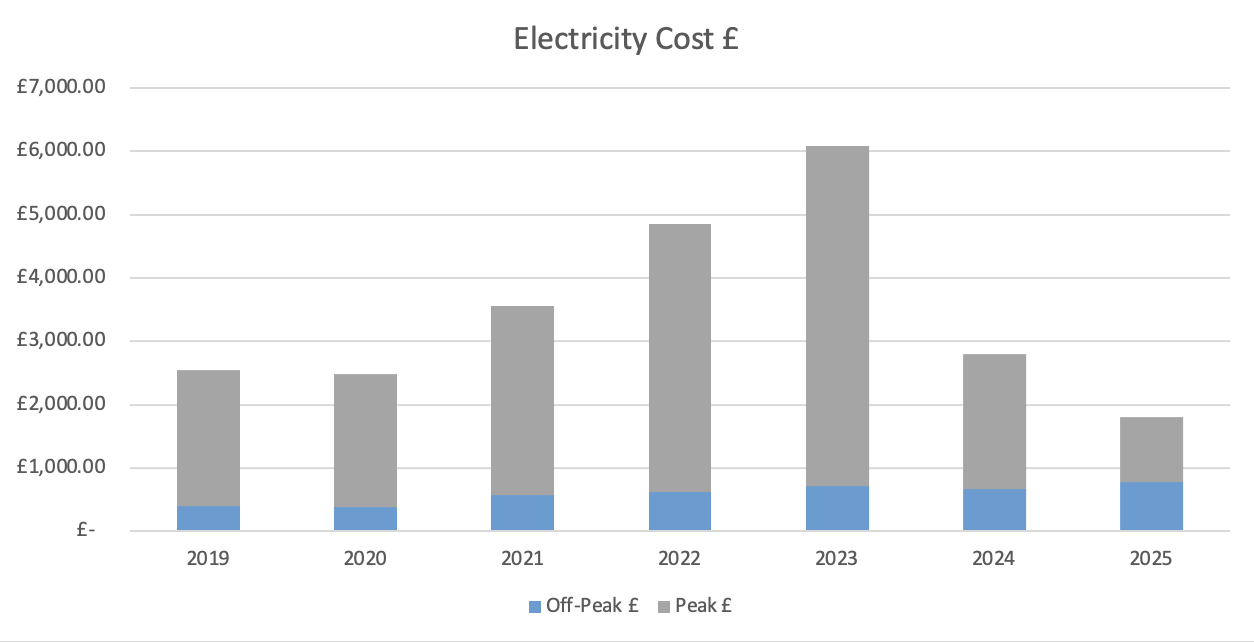
The cost charts show another drop for 2025
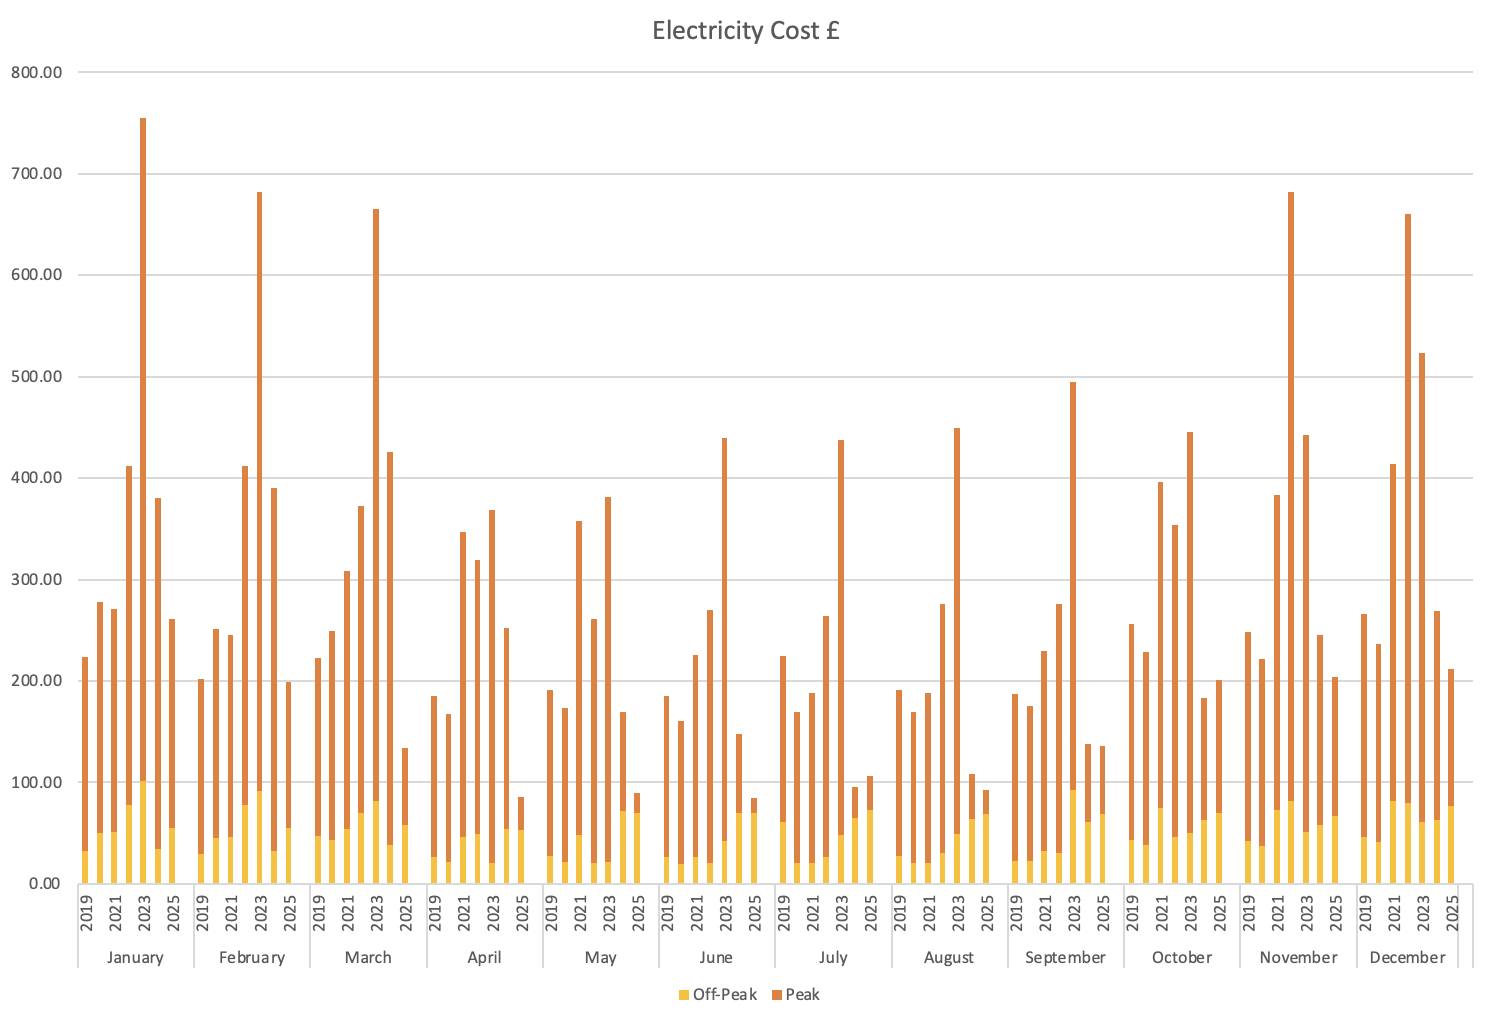
Further reduction for electricity are seen in the months up to July, where I did not have my East and West arrays last year.
Electricity usage vs cost by year
and the same for gas
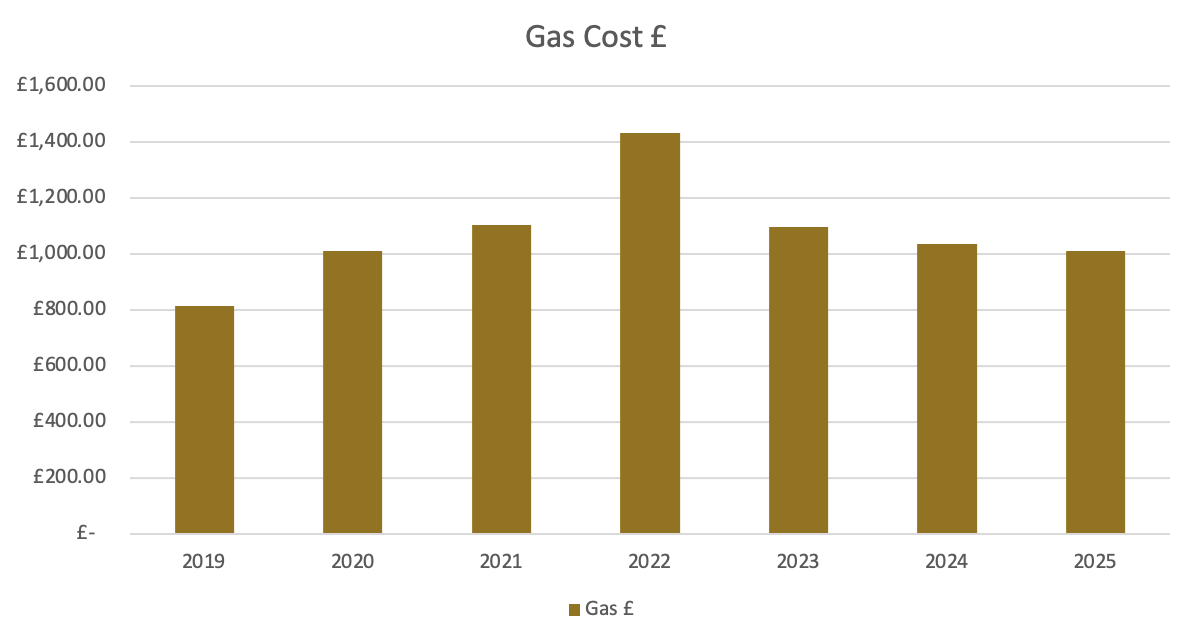
The total saving for 2025 vs 2023 are over £4,600, of which only £80 are related to gas.