
This is the third full month with the solar being active.
Peak and off-peak electricity prices dropped from £0.279 Peak and £0.075 Off-Peak to £0.244 and £0.070 respectively, the standing charge remained the same at £0.456 per day.
My East/West solar arrays went live late on the first day of the month, so this will hopefully provide yet more savings
I was also accepted by Octopus Energy for their ‘non MCS compliant’ Solar Export Guarantee (SEG) export tariff around the middle of the month, more on that later.
July Electric
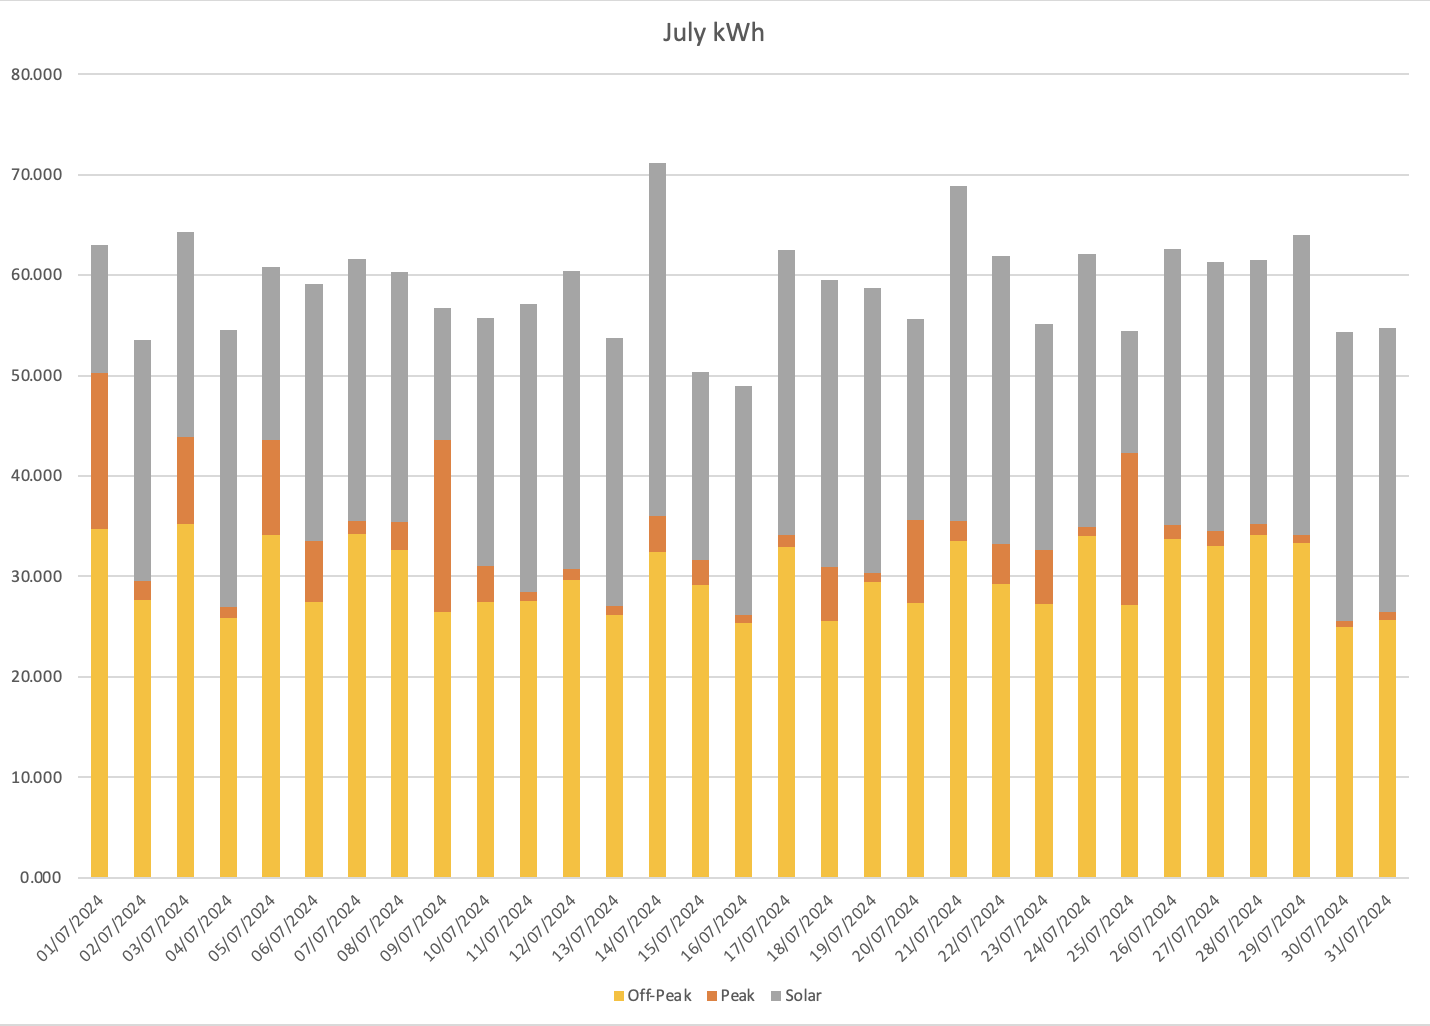
The average daily consumption, including solar, for the month of July was 58.76kWh, we had a much bigger variation in solar production from a low of 12.25kWh up to a high of 49.10kWh.
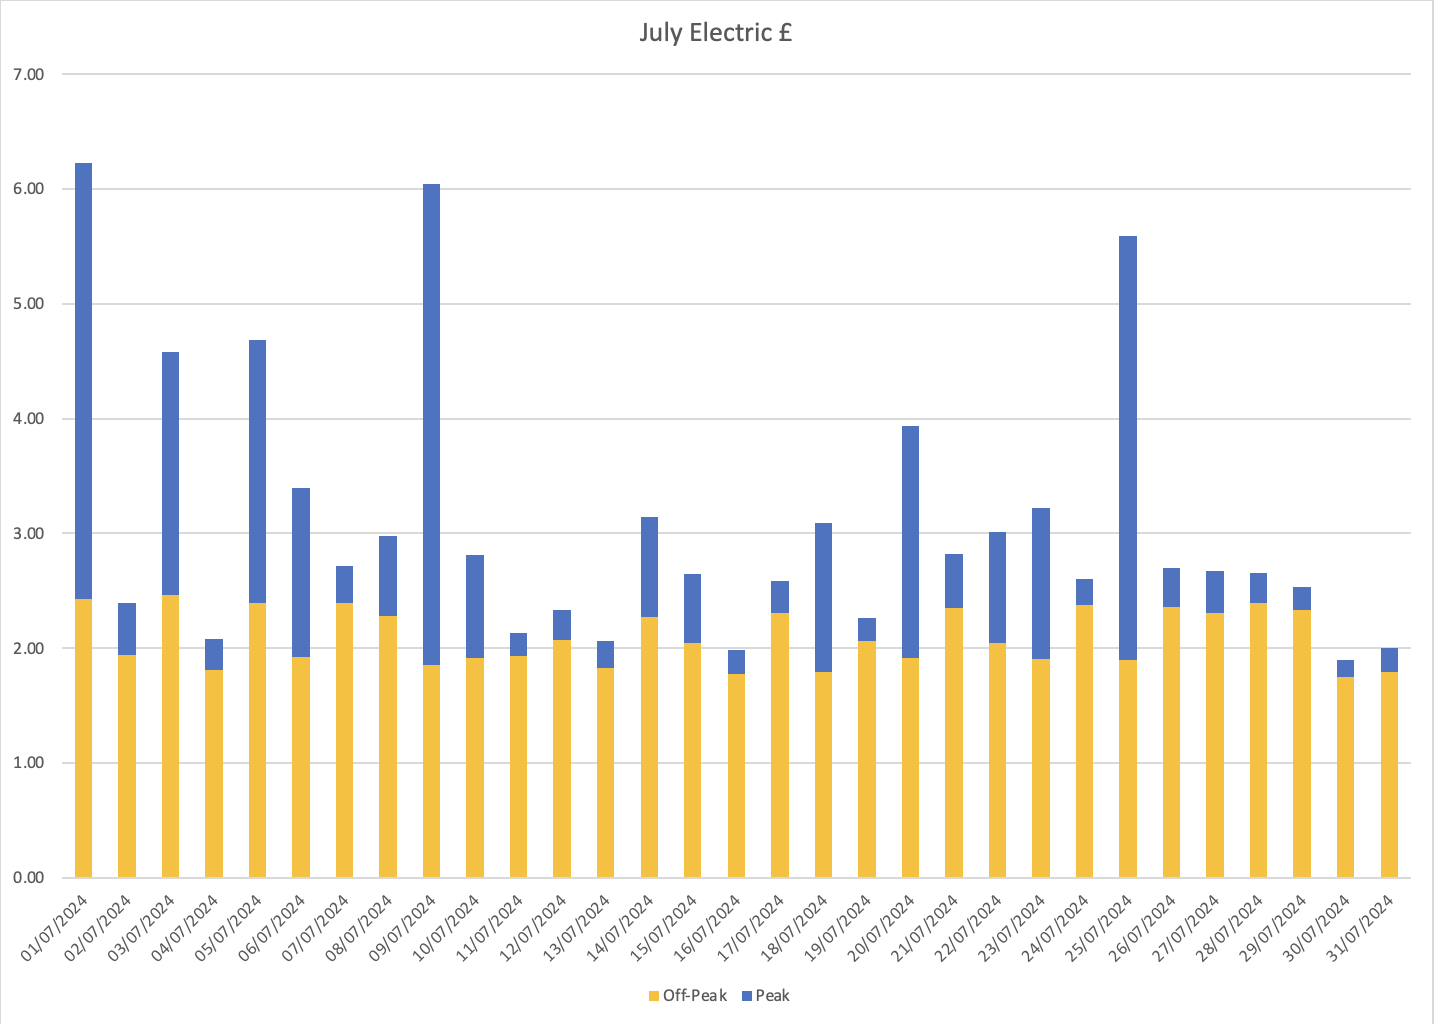
This in turn reflects quite visibly in the cost chart where we have a low of £0.15 and a high of £4,19 for peak electric usage.
It is easy to see from the Electricity cost graph which days were overcast/wet as they have much larger dark blue sections, the seesaw/sawtooth pattern for the Off-Peak is largely due to whether or not the car was charged that night.
The average peak to off-peak percentage usage for the month was 10.74%, so maintaining the desired 25% or better reversal from pre solar.
Average usage: off-peak 29.92kWh, peak 4.08kWh, total 33.78kWh
Average costs: off-peak £2.09, peak £1.00, total £3.55 (including standing charge of £0.4557)
July Gas
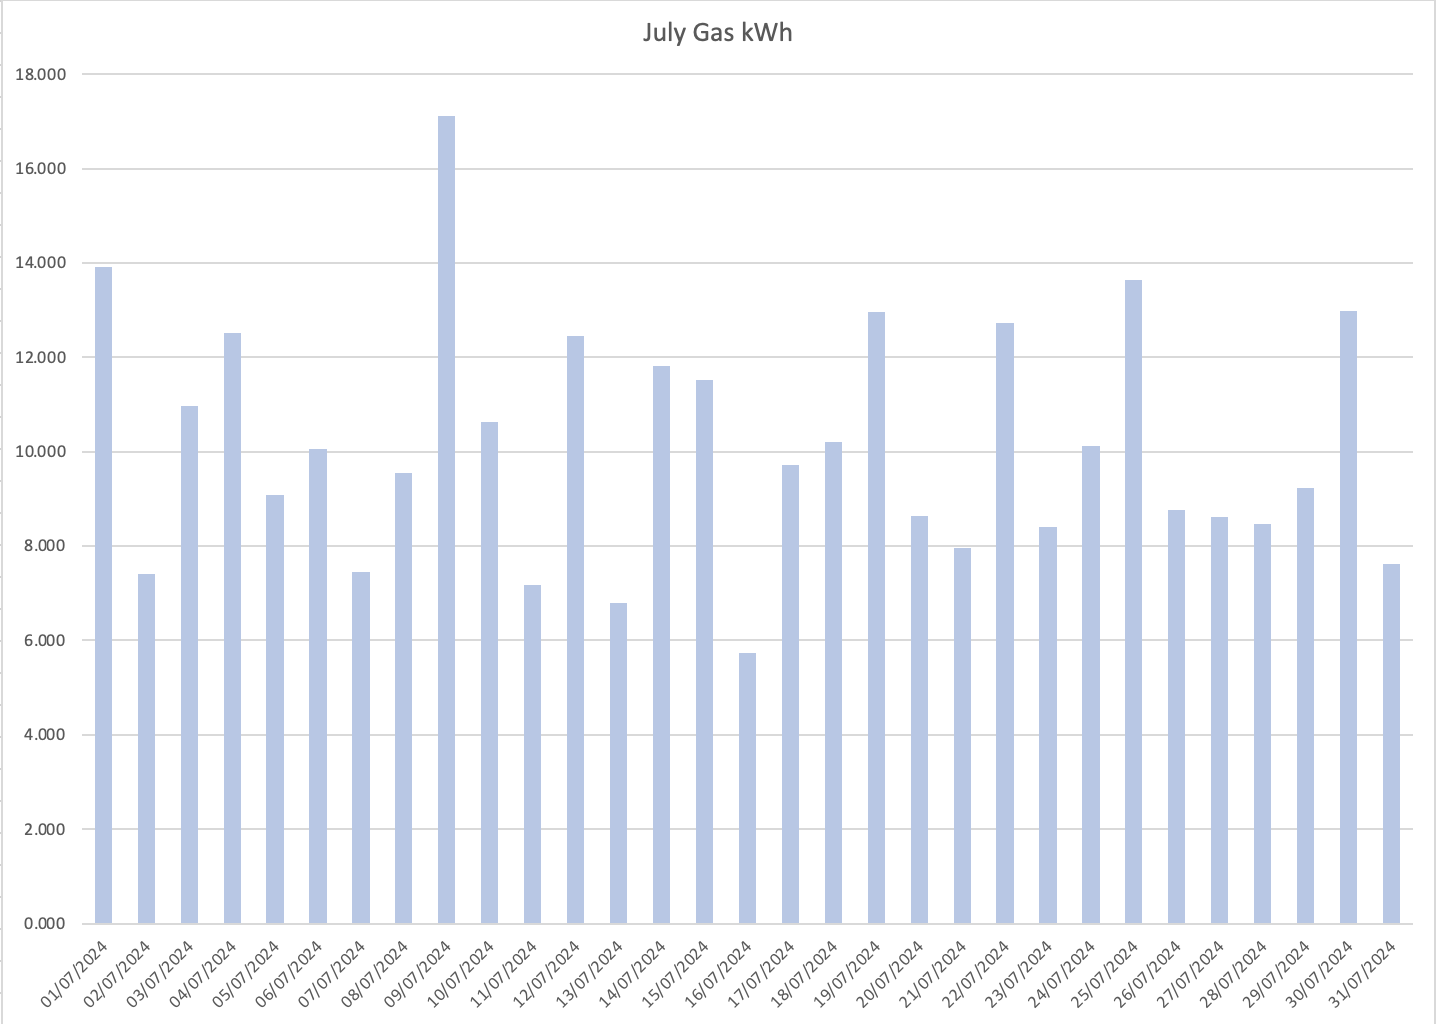
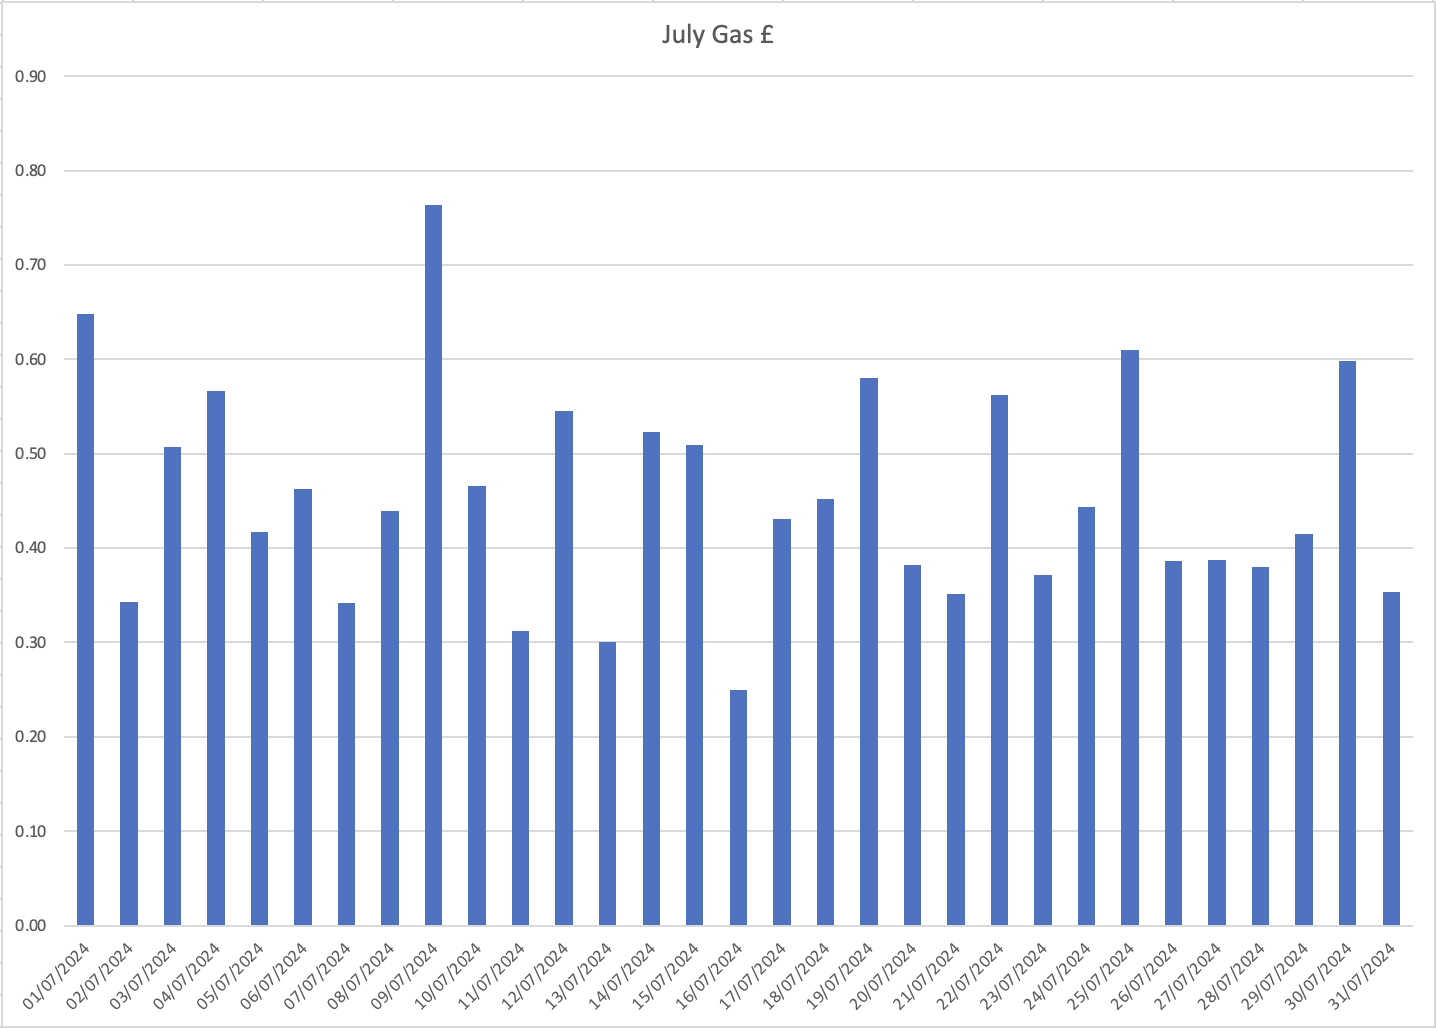
Once again the gas was off for the entire month, highest gas usage was 13.9kWh and the lowest 5.7Wh – £0.65 and £0.52 respectively (including the standing charge of £0.2747).
Average usage: 10.14kWh
Average cost: £0.73 (including standing charge of £0.2747)
Total daily energy average cost for July: £4.28 (including standing charges of £0.7304).
Total costs for July were £64.92 off-peak, £30.88 peak, £14.10 gas, £132.53 overall (including standing charge of £22.64).
July 2023 costs were £48.63 off-peak, £388.39 peak, £-181.58 gas, £268.36 overall (including standing charge of £20.82).
(There was a substantial refund against July 2023 and then August 2023 for what I was paying for Gas)
A 50% saving on the overall costs and discounting the Gas, nearly a 79% saving for electricity alone compared to 2023!
July costs for 2024 using Dec 2023 E-ON tariffs £116.48 off-peak, £44.09 peak, £28.90 gas, £189.46 overall (including standing charge of £20.82).
So the practical saving was £56.25 vs staying on my old E-ON tariffs.
However I also had my SEG tariff enabled from the middle of the month and was able to export a total of 179.75kWh of electricity at £0.15 per kWh for a total saving of £26.96
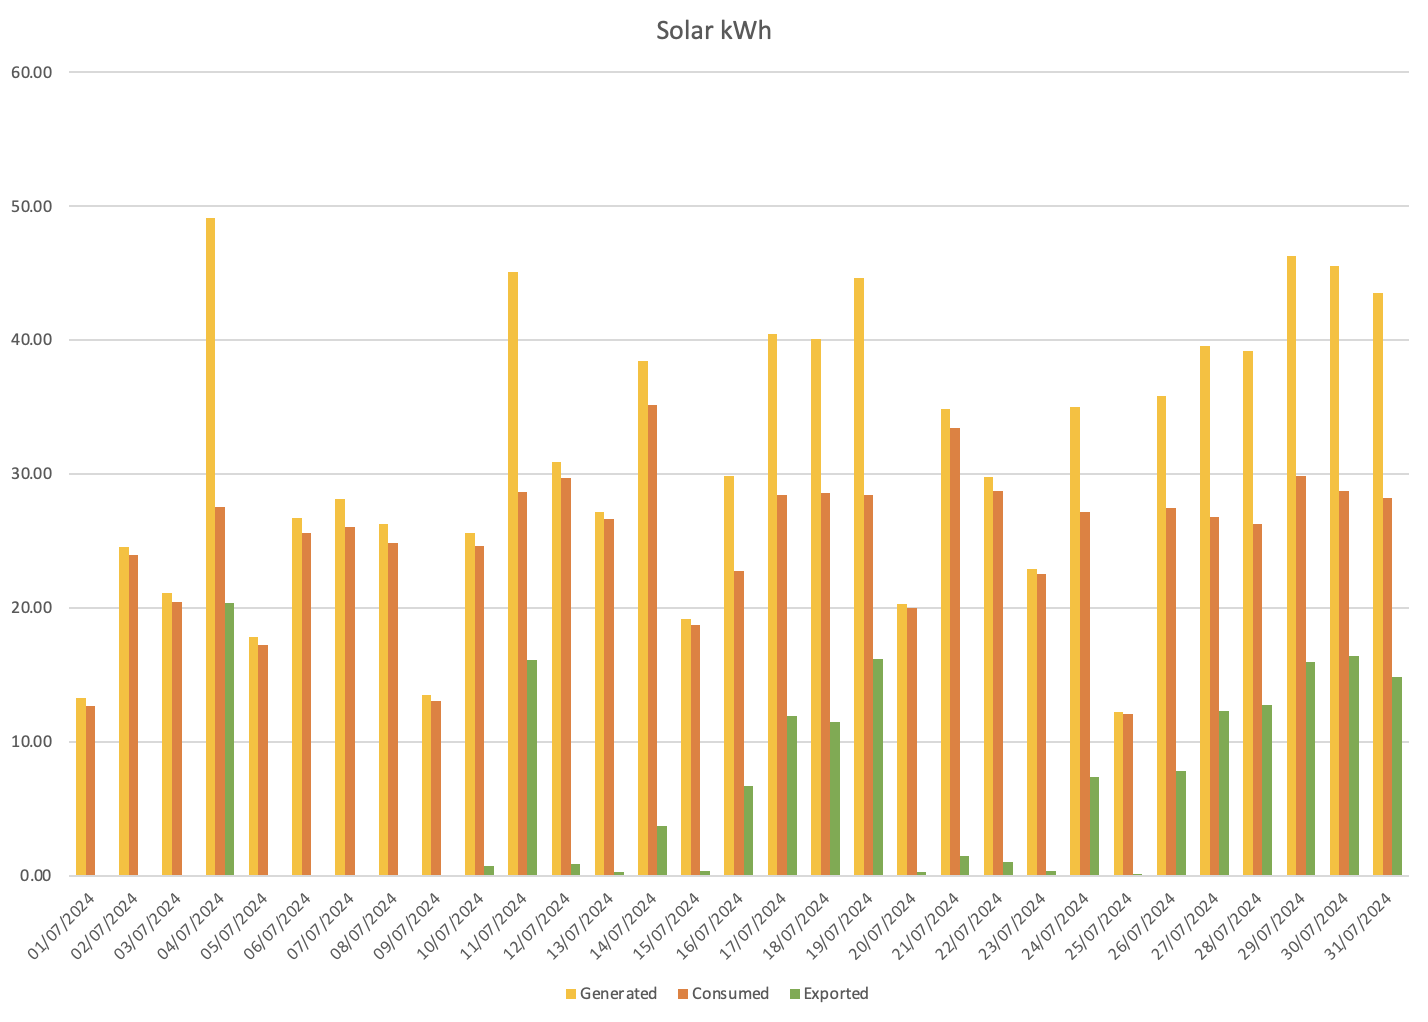
This new graph shows a comparison between solar generated, consumed and exported.
I will again use the same assumption as last month of 14.5kWh of battery, there were a few days where I carried some battery charge to the next day, but this was largely insignificant.
So for this month, I have 31 days of solar production which means 14.5kWh x 31 days = 449.5kWh for the batteries that need to ‘swap’ from off-peak to peak rate.
I then produced 966.80kWh of solar, 179.75kWh of which was given back to the grid.
This means that the additional savings for having solar and batteries are (449.5kWh * (£0.2439 – £0.070)) + ((966.80-179.75)kWh) * £0.2439), = (449.5kWh * £0.1739) + (787.05kWh * £0.2439) = £78.18 + £191.99 = £270.17
Which in effect means that I have saved £270.17 + £56.25 + £26.96 = £353.37 compared to my old E-ON tariff and no solar/batteries for the month of July.
These are the graphs of forecast vs actual production:
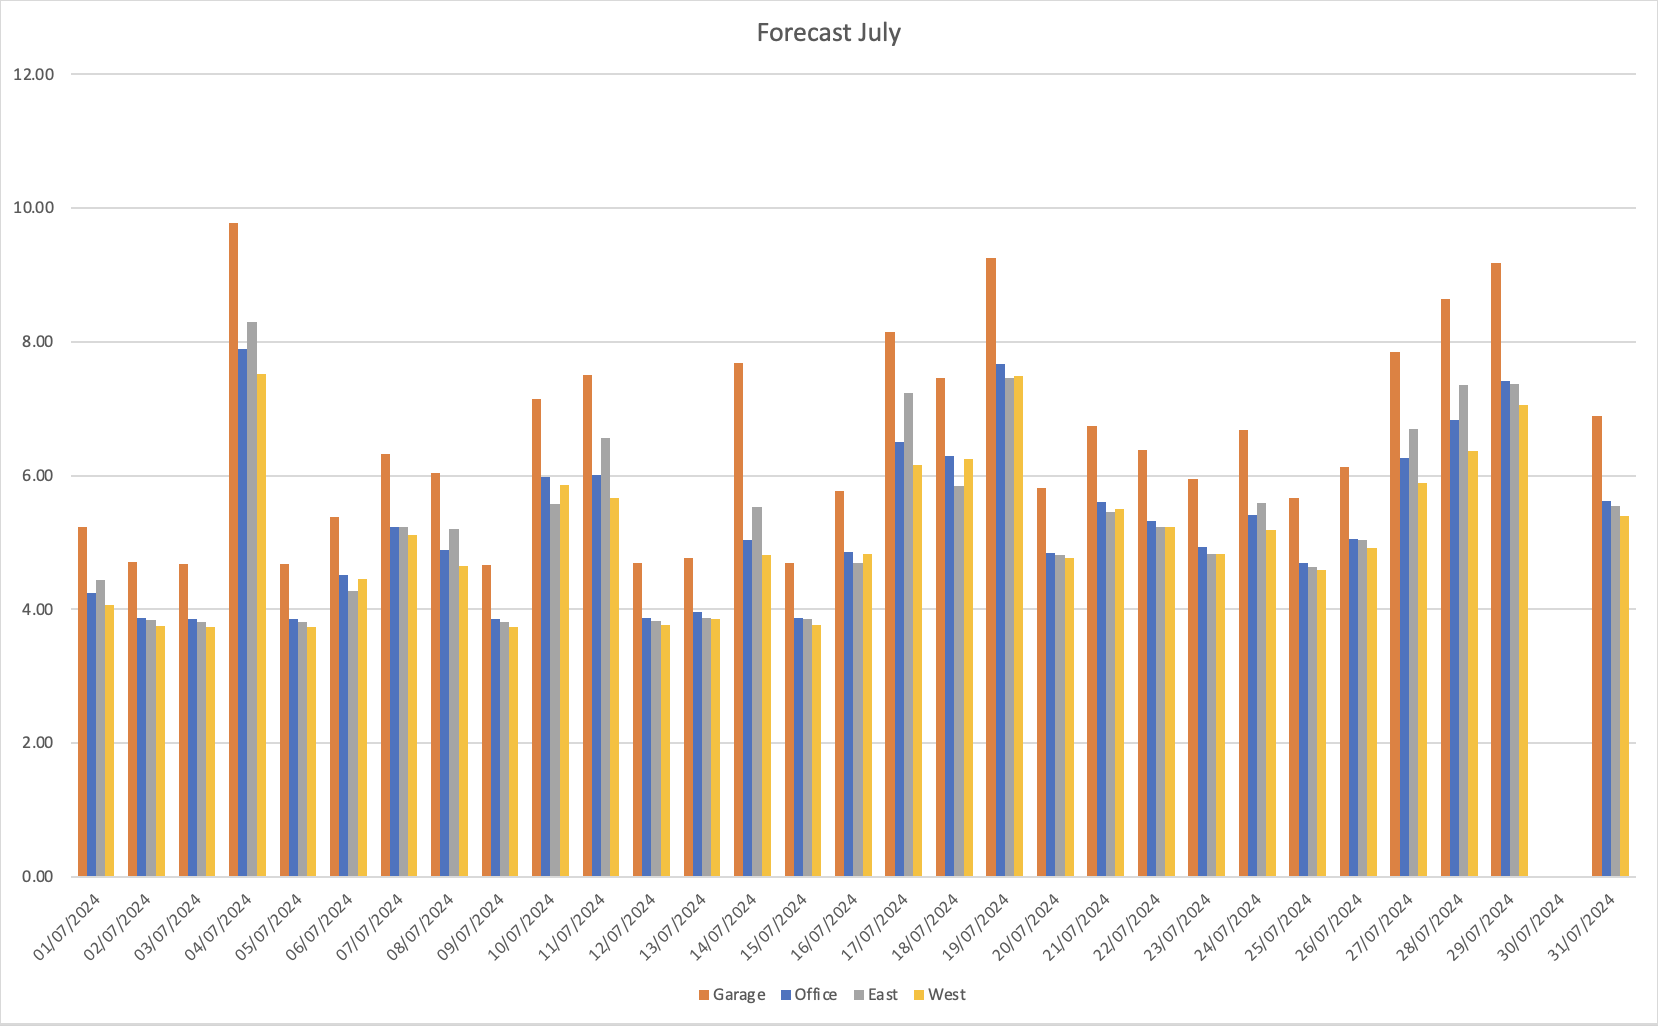
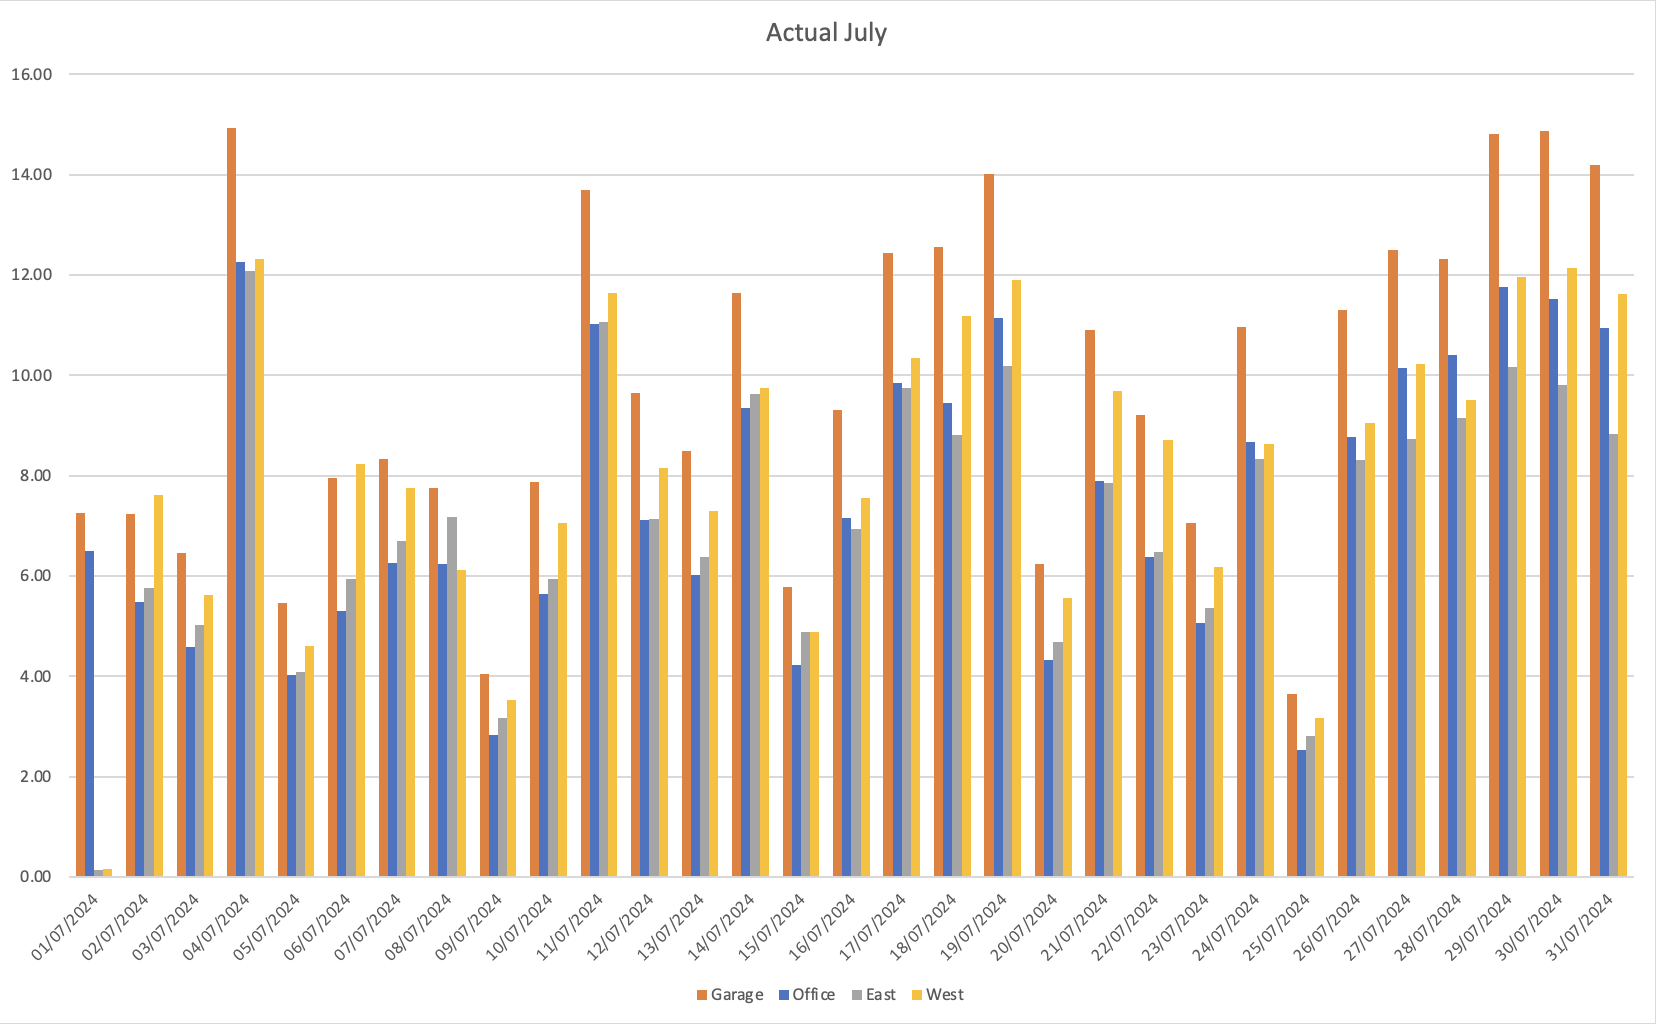
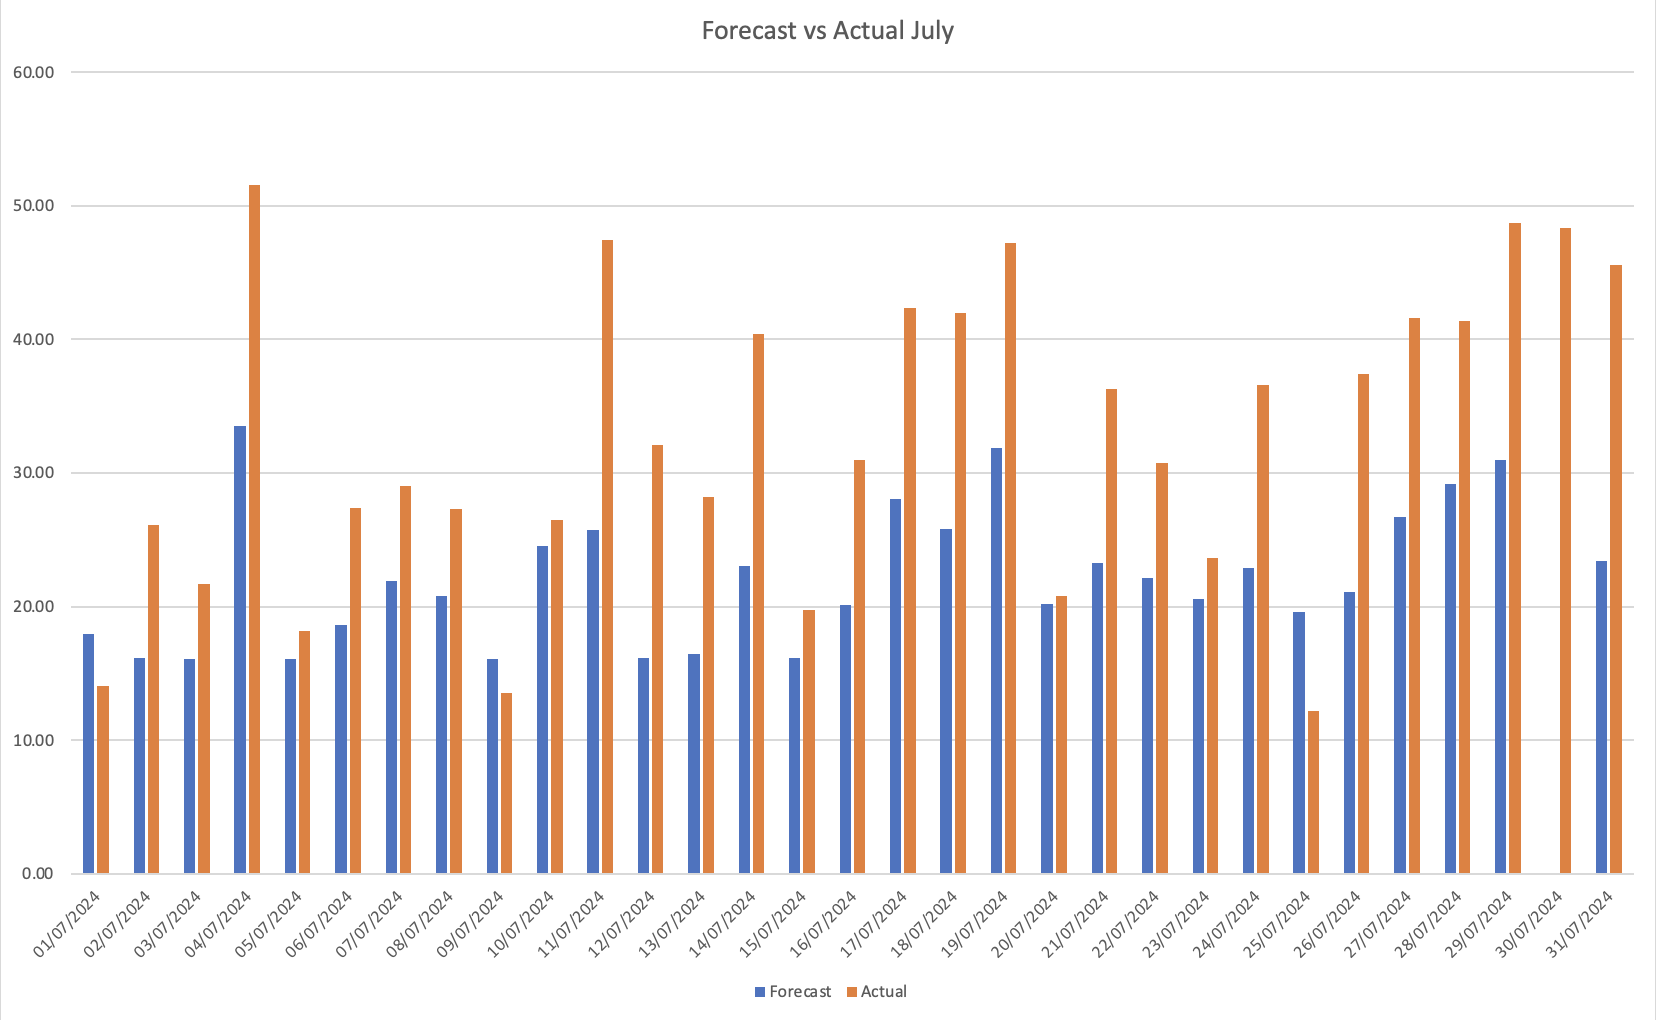
The first graph shows forecasted production for each of the 4 arrays, garage, office, east and west.
The Actual production data is shown for the garage and office arrays in the middle graph and then forecast compared to actual in the third graph for all of the arrays.
On sunny days I am still massively exceeding the forecast, dull days, I either match or am slightly behind the forecast.
For some reason, my forecast data was empty for 30th July, hence the gap in the charts.
Month on month usage and cost graphs for 2024 (not including exports) for Electicity:
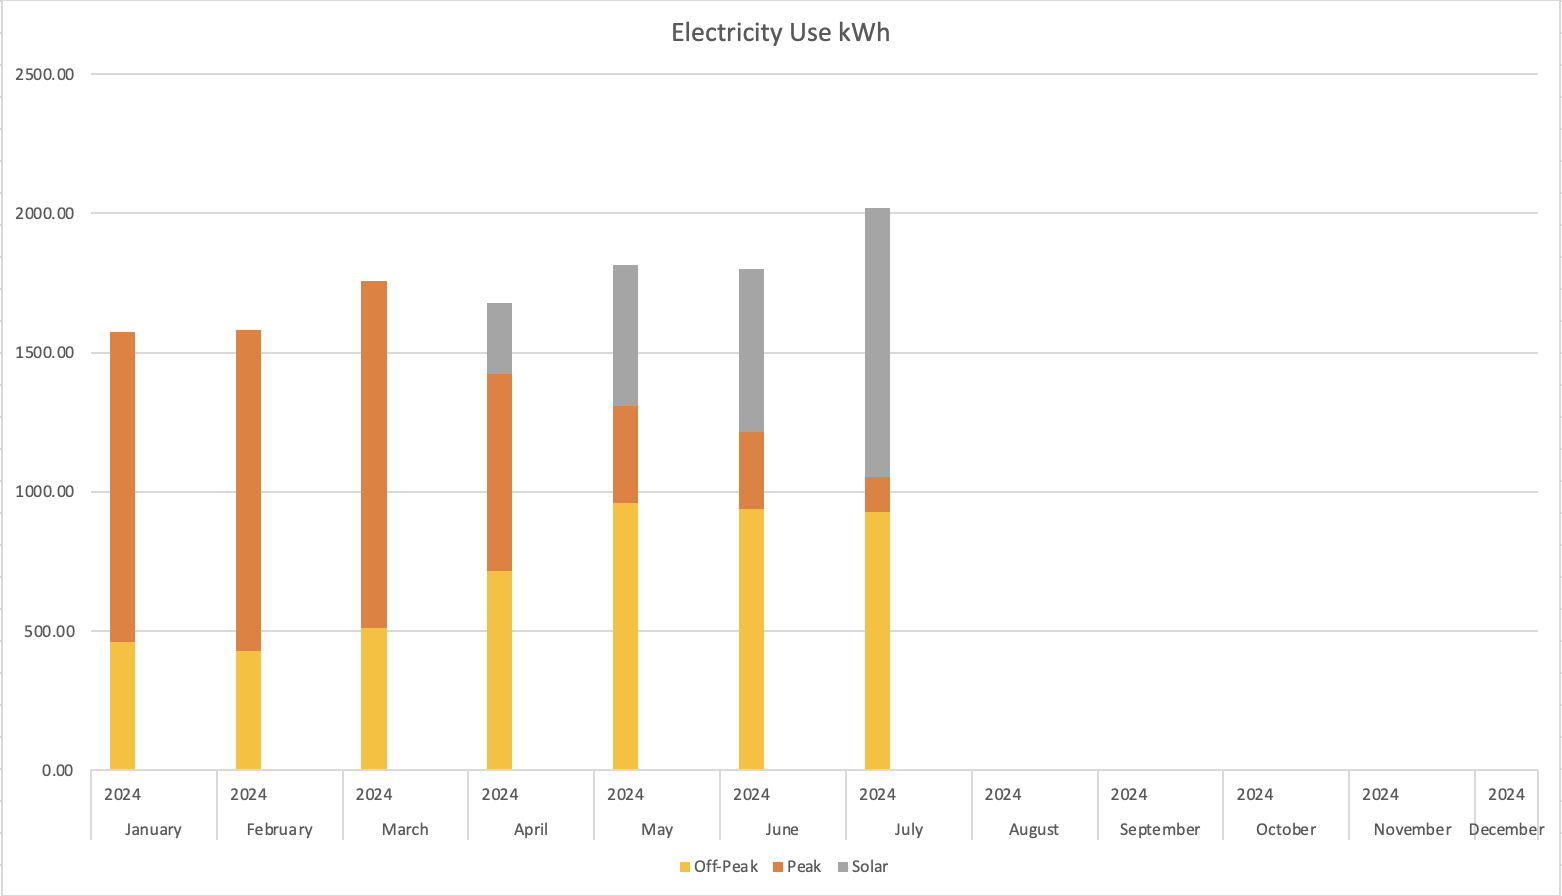
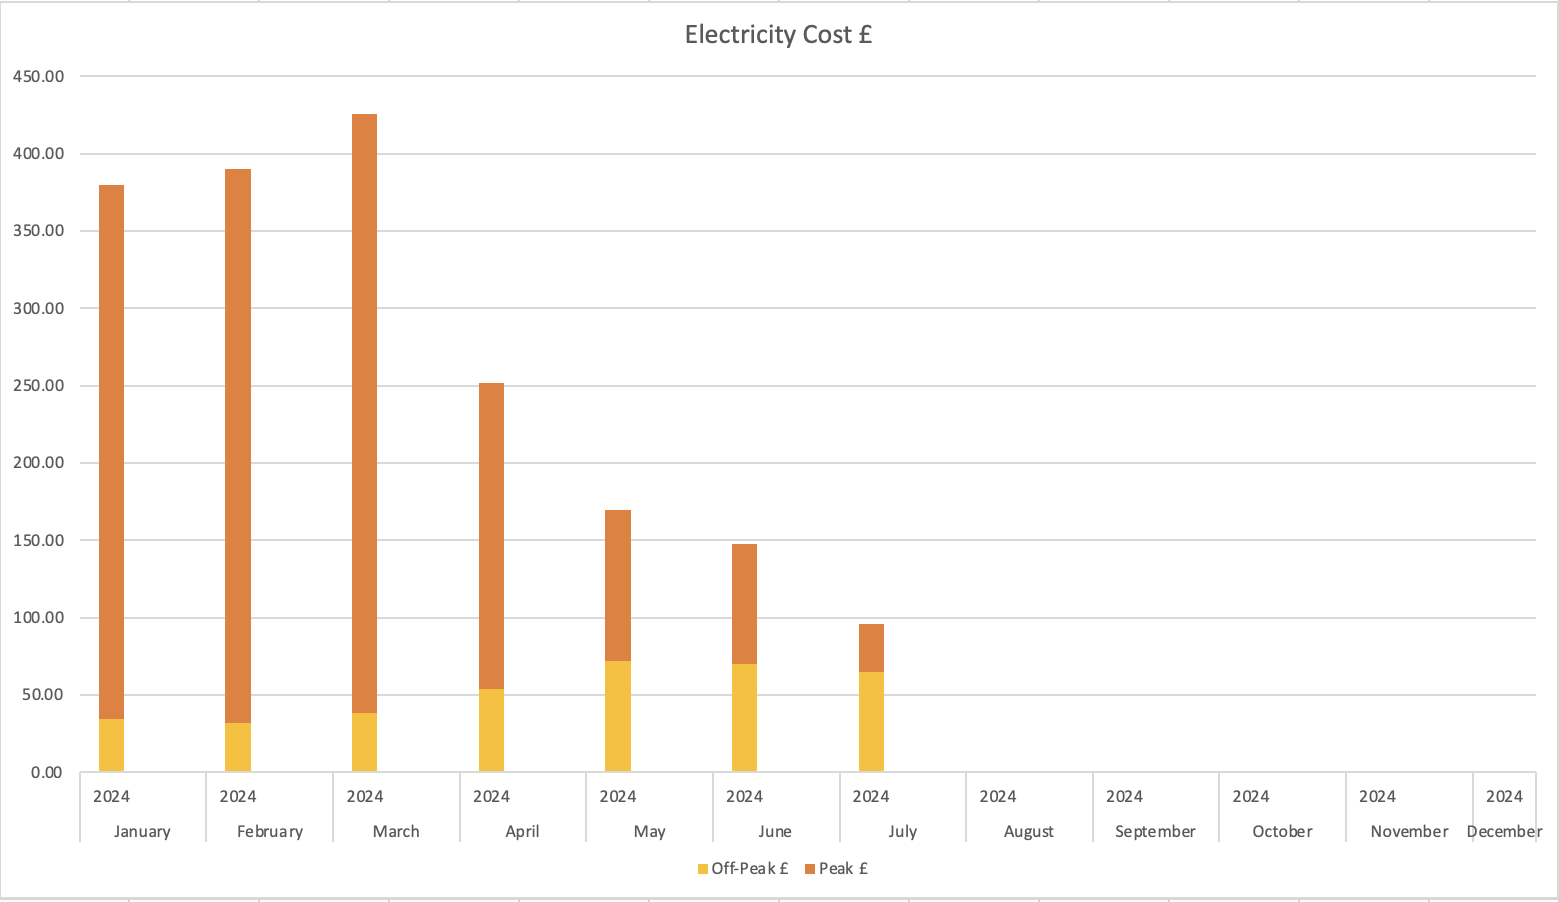
It is easy to see the impact that the various solar arrays and batteries are having on the usage and costs for electricity.
and the same for Gas:
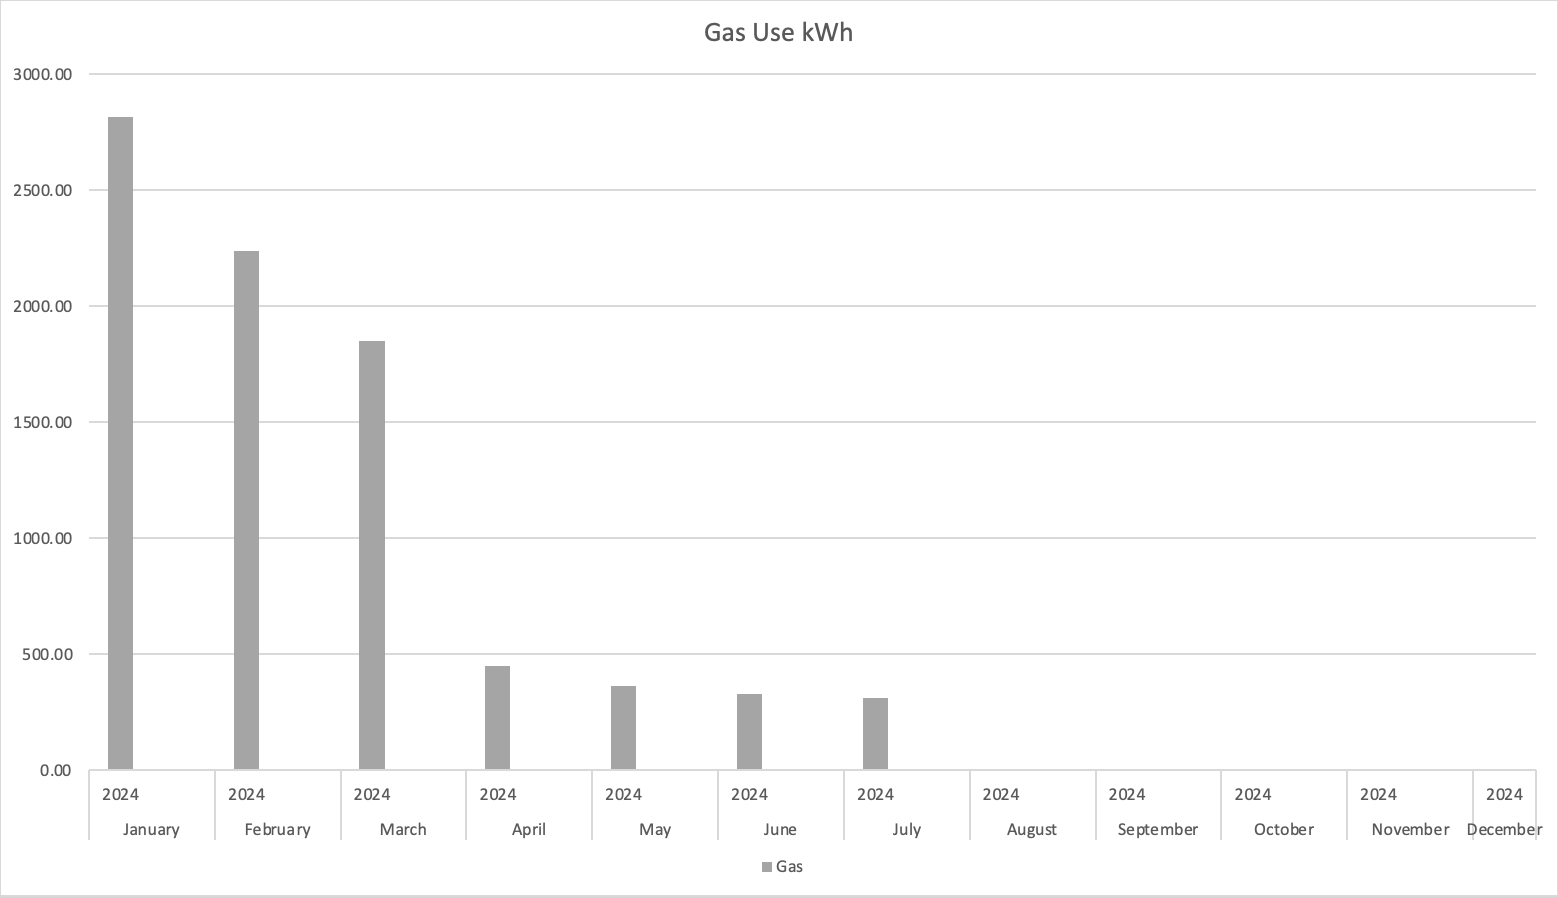
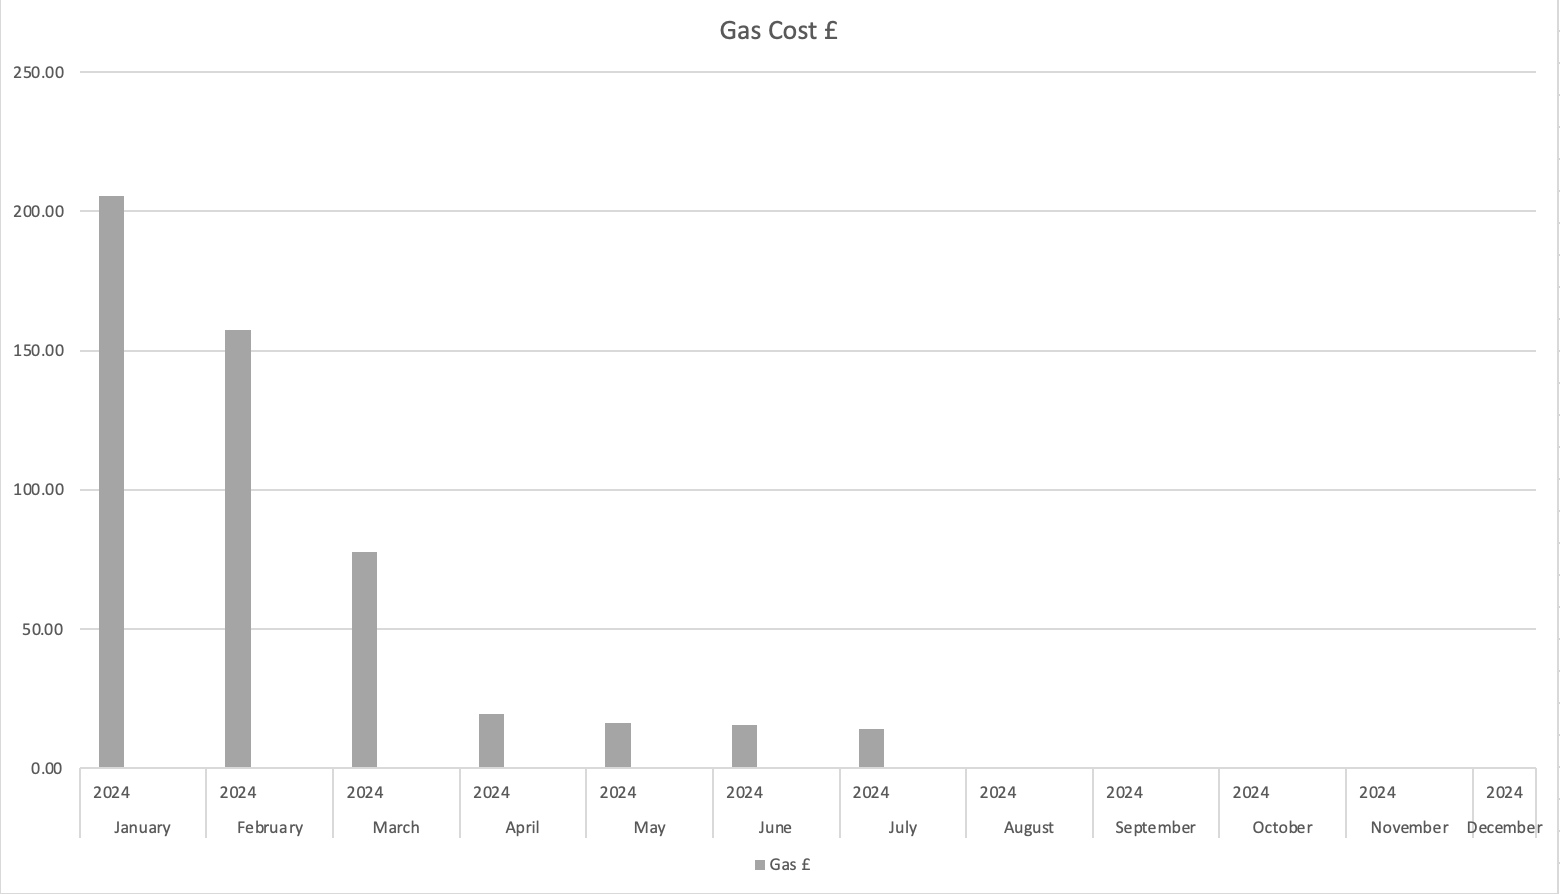
The biggest drop in cost was for when I switched to the tracker tariff, then four months of having the heating turned off.