This should be an interesting set of graphs as I commissioned my solar and battery system around the middle of the month, so can see the impact it has on the usage and costs.
Additionally my peak electricity cost dropped from £0.3103/kWh to £0.2794/kWh, however the standing charge went up from £0.4201 to £0.4785 per day.
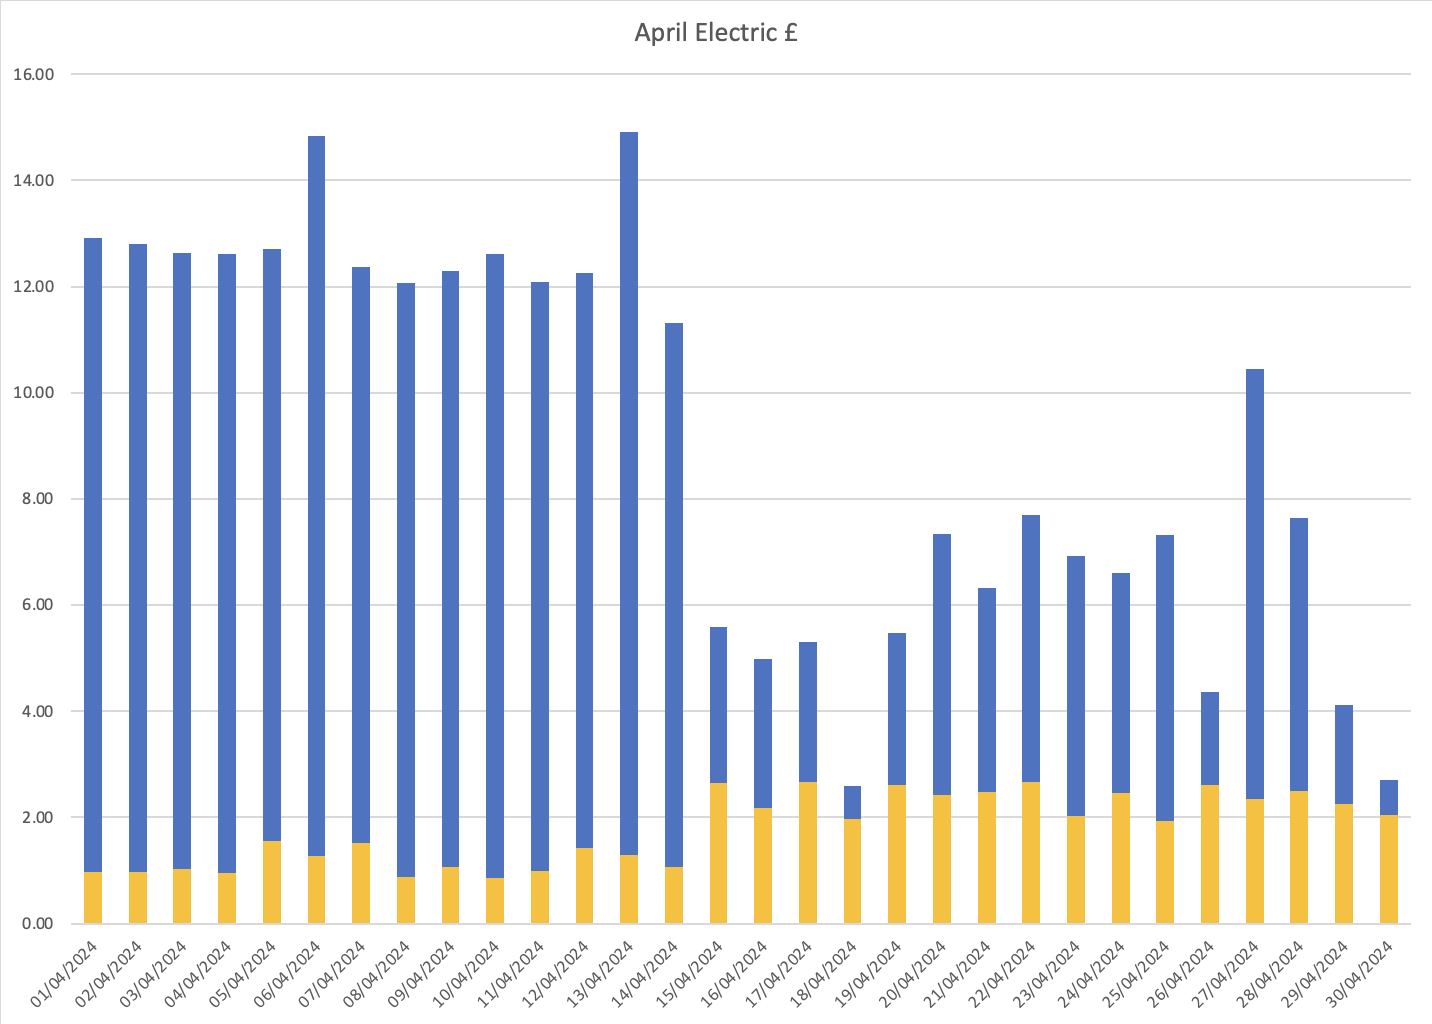
April Electric
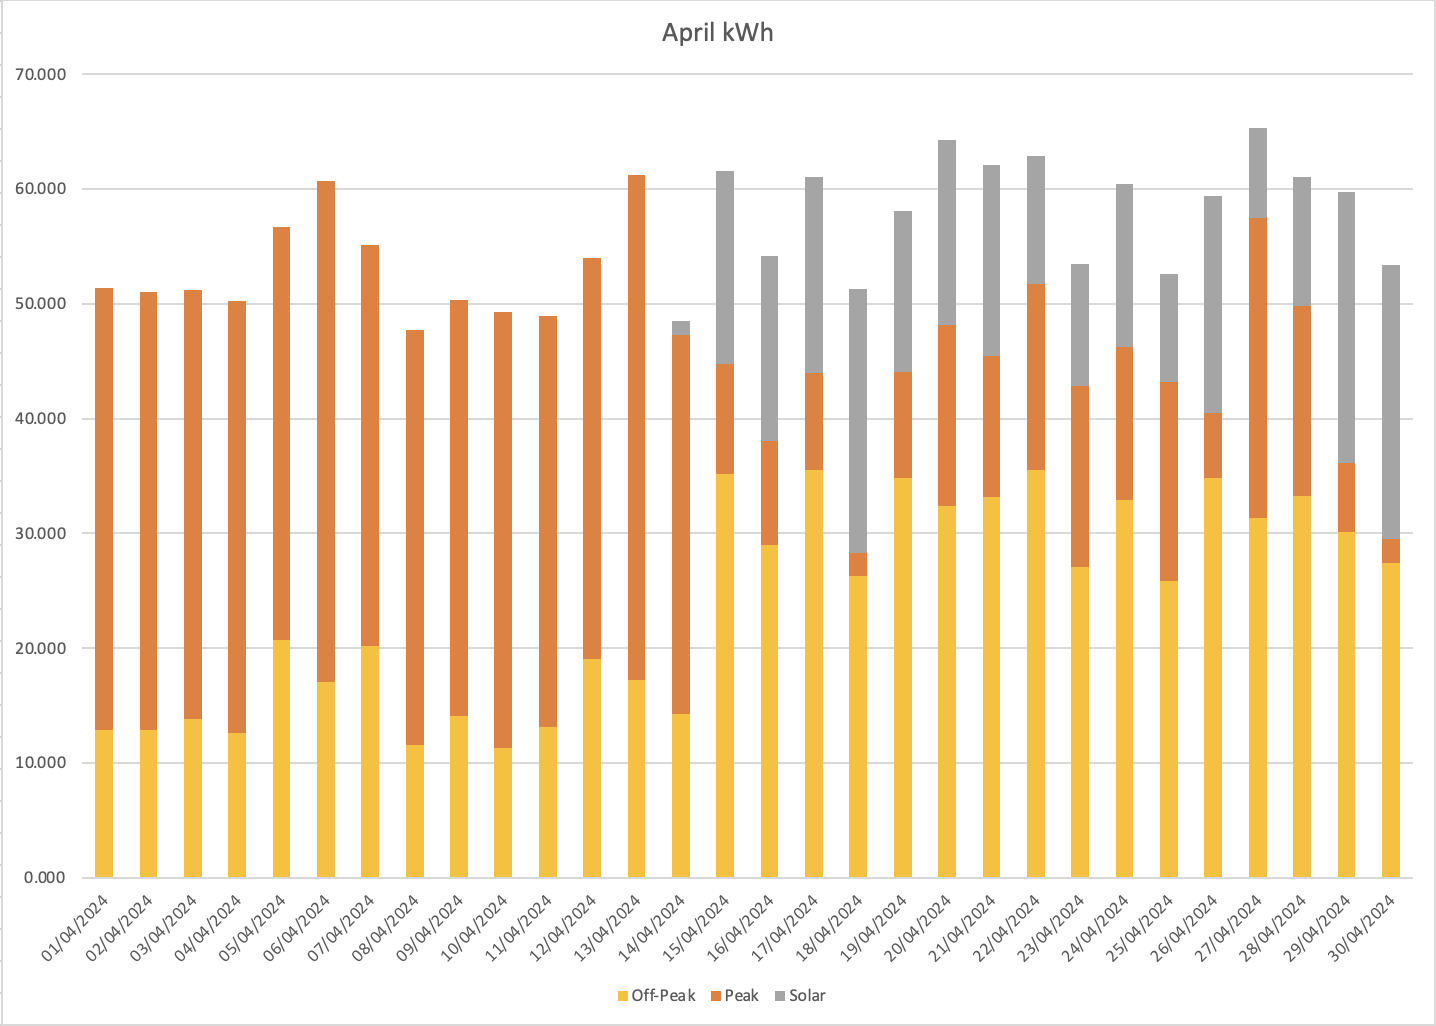
You can see from the usage chart that if anything my total average electrical usage went up rather than down, the new grey aspect is the solar generation.
Off peak usage has nearly doubled and peak usage has shrunk significantly, this then transfers over to the cost graph as nearly 50% drop in daily costs.
My peak to off-peak percentage has changed from an average of 71% peak to around 25% peak with solar picking up 20-45% depending on sunshine levels.
April 18th, 29th and 30th were my best days for production, all with over 23kWh of production, which resulted in less than 6 kWh of peak electricity draw fro the grid for a daily cost of under £5.00 total (including the standing charge).
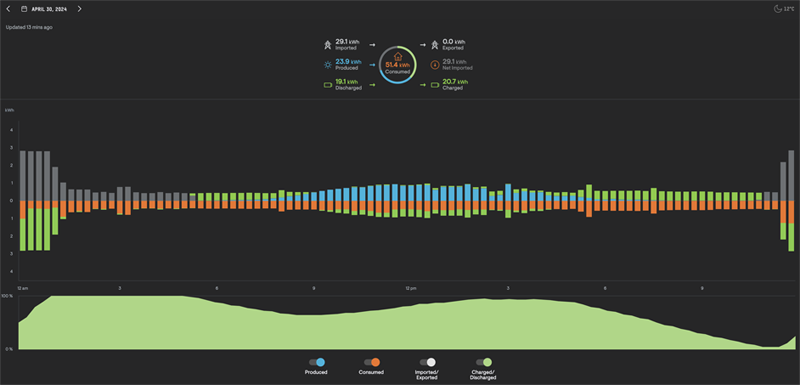
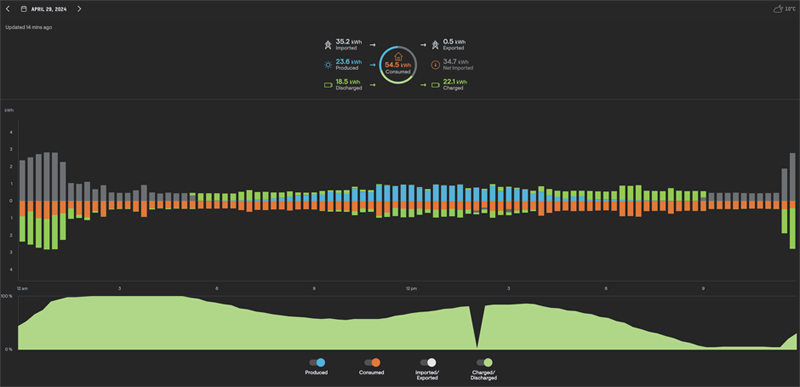
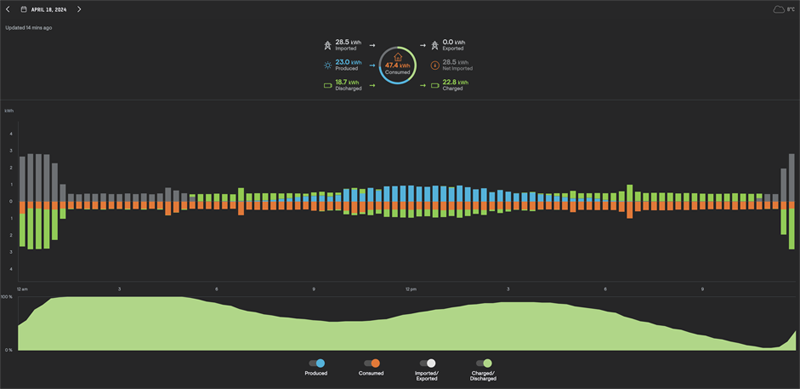
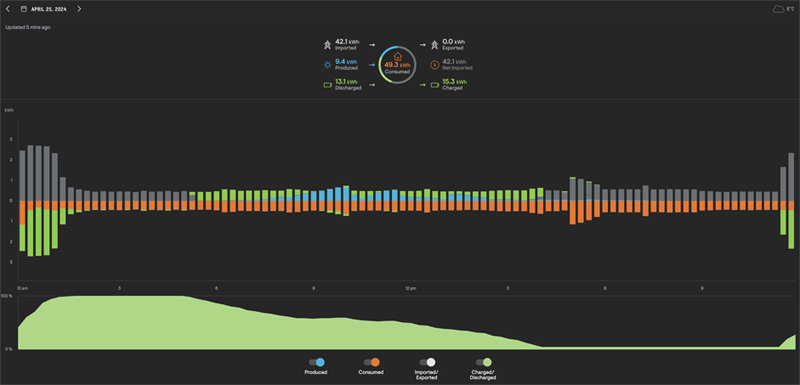
Above are the charts from the Envoy app showing consumption, production and battery charge.
The V shaped dip in battery charge shown on the graph for April 29th is because the system decided to perform a software update at that time.
The worst days were the 25th and 27th with less than 10kWh of production, where the weather was pretty terrible with a fair amount of rain and cloud cover and not much sun.
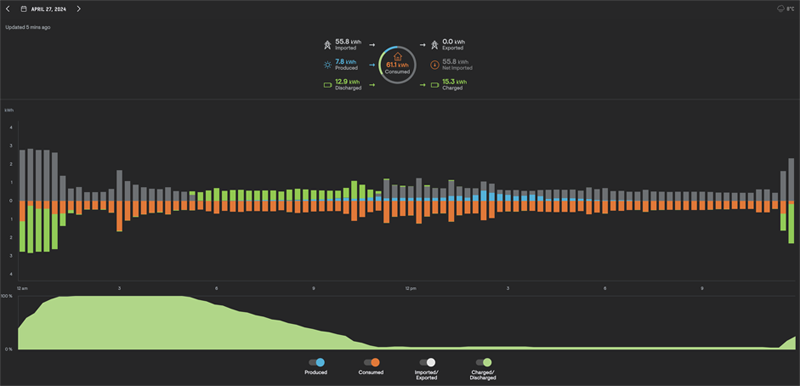
On April 27th the battery was drained by 11:00 and I was running off peak electricity for the remainder of the day which resulted in 26kWh of peak electricity and a total daily cost of £10.88 (including the standing charge).
Even on this worst day, the total cost for electricity was down by 33% from my pre-solar average.
Average usage: off-peak 23.85kWh, peak 23.65kWh, total 47.51kWh
Average costs: off-peak £1.79, peak £6.61, total £8.85 (including standing charge of £0.4785)
April Gas
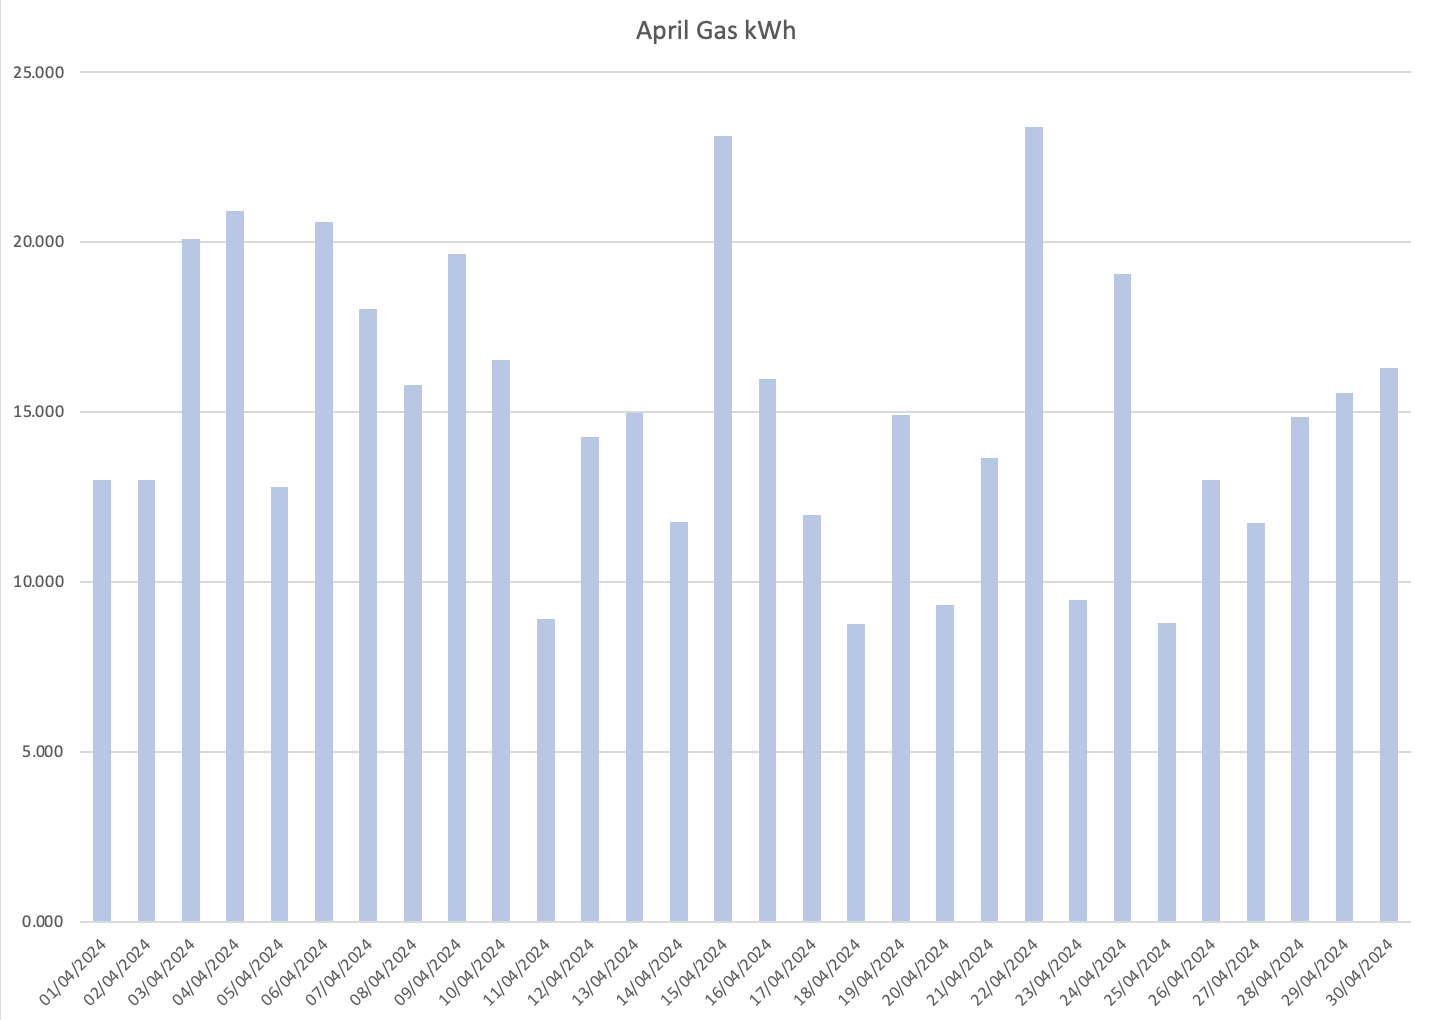
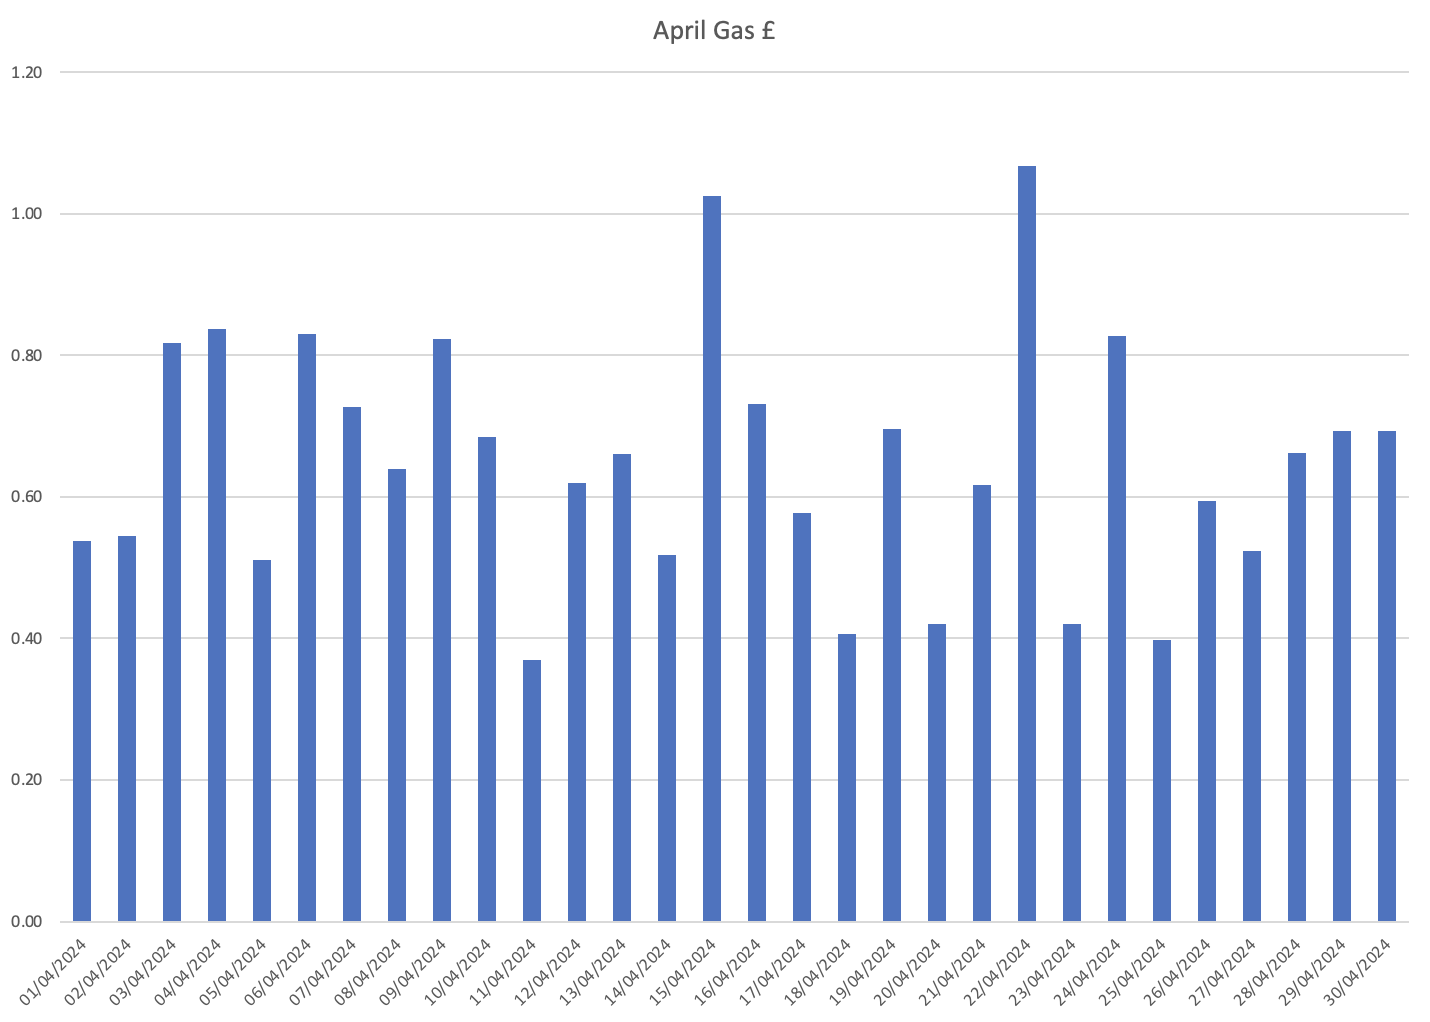
The heating was off for the entire month, highest gas usage was 20.9kWh and the lowest 8.7kWh – £1.11 and £0.67 respectively (including the standing charge).
Average usage: 15.00kWh
Average cost: £0.92 (including standing charge of £0.2747)
Total daily energy average cost for April: £9.78 (including standing charges of £0.6948).
Total costs for April were £53.67 off-peak, £198.24 peak, £27.82 gas, £294.08 overall (including standing charge of £20.84).
April 2023 costs were £20.97 off-peak, £348.01 peak, £148.05 gas, £537.85 overall (including standing charge of £19.56).
Still maintaining close to 50% savings compared to 2023.
April costs for 2024 using Dec 2023 E-ON tariffs £89.88 off-peak, £247.16 peak, £28.06 gas, £373.41 overall (including standing charge of £19.56).
So the practical saving was £80.35 vs staying on my old E-ON tariffs.
The savings compared to not having solar and batteries is a little more complex as this would need to assume that I used the same total amount of electricity but was charged for it across the peak and off-peak periods as appropriate.
As such any savings from battery charging at a cheap rate and free energy from solar generation would need to be factored in at an equivalent peak rate, since that is when the energy is actually being used.
As such I will assume 14.5kWh for the battery each day (as it was always drained before the end of the day to its 4% minimum charge) and then add whatever is produced by the solar and see what this comes to then multiply this by the peak rate for a cost.
So for this month, I have 16 days of solar production (I am ignoring the setup day) which means 14.5kWh x 16 days = 240kWh for the batteries that need to ‘swap’ from off-peak to peak rate.
I then produced 251kWh of solar, no significant amount of which was given back to the grid.
This means that the additional savings for having solar and batteries are (232kWh * (£0.2794 – £0.075)) + (251kWh * £0.2794), = (232kWh * £0.2044) + (251kWh * £0.2794) = £47.42 + £70.13 = £117.75
Which in effect means that I have saved £117.55 + £80.35 = £198.10 compared to my old E-ON tariff and no solar/batteries for the month of April.
The average daily electricity cost has dropped by nearly 33% compared to the previous 3 months and the solar and battery system was only active for half of the month.
The solar generation is probably typical of Spring or Autumn, Winter will probably be worse, although there may be some clear sunny days and hopefully summer will be better with longer sunnier days.
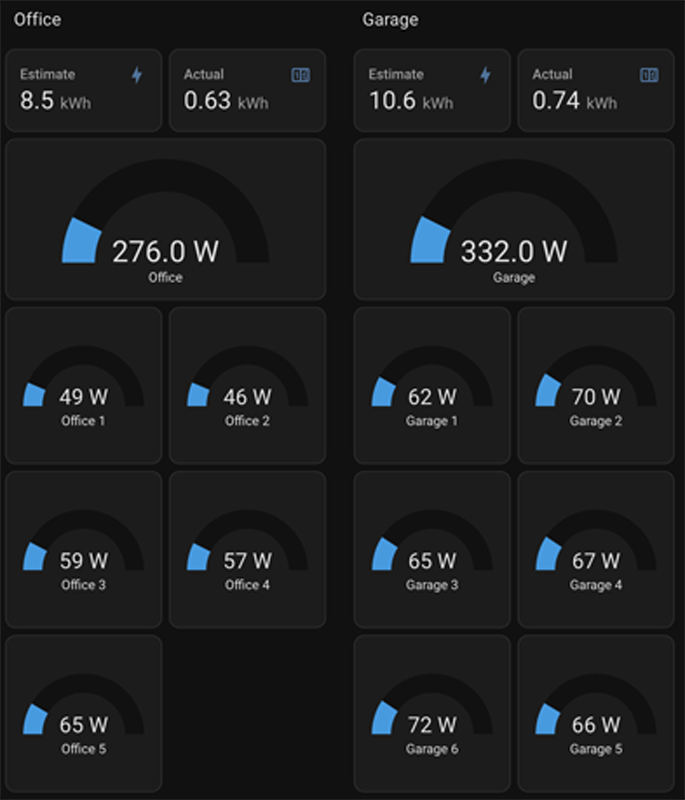
These are the graphs of forecast vs actual production
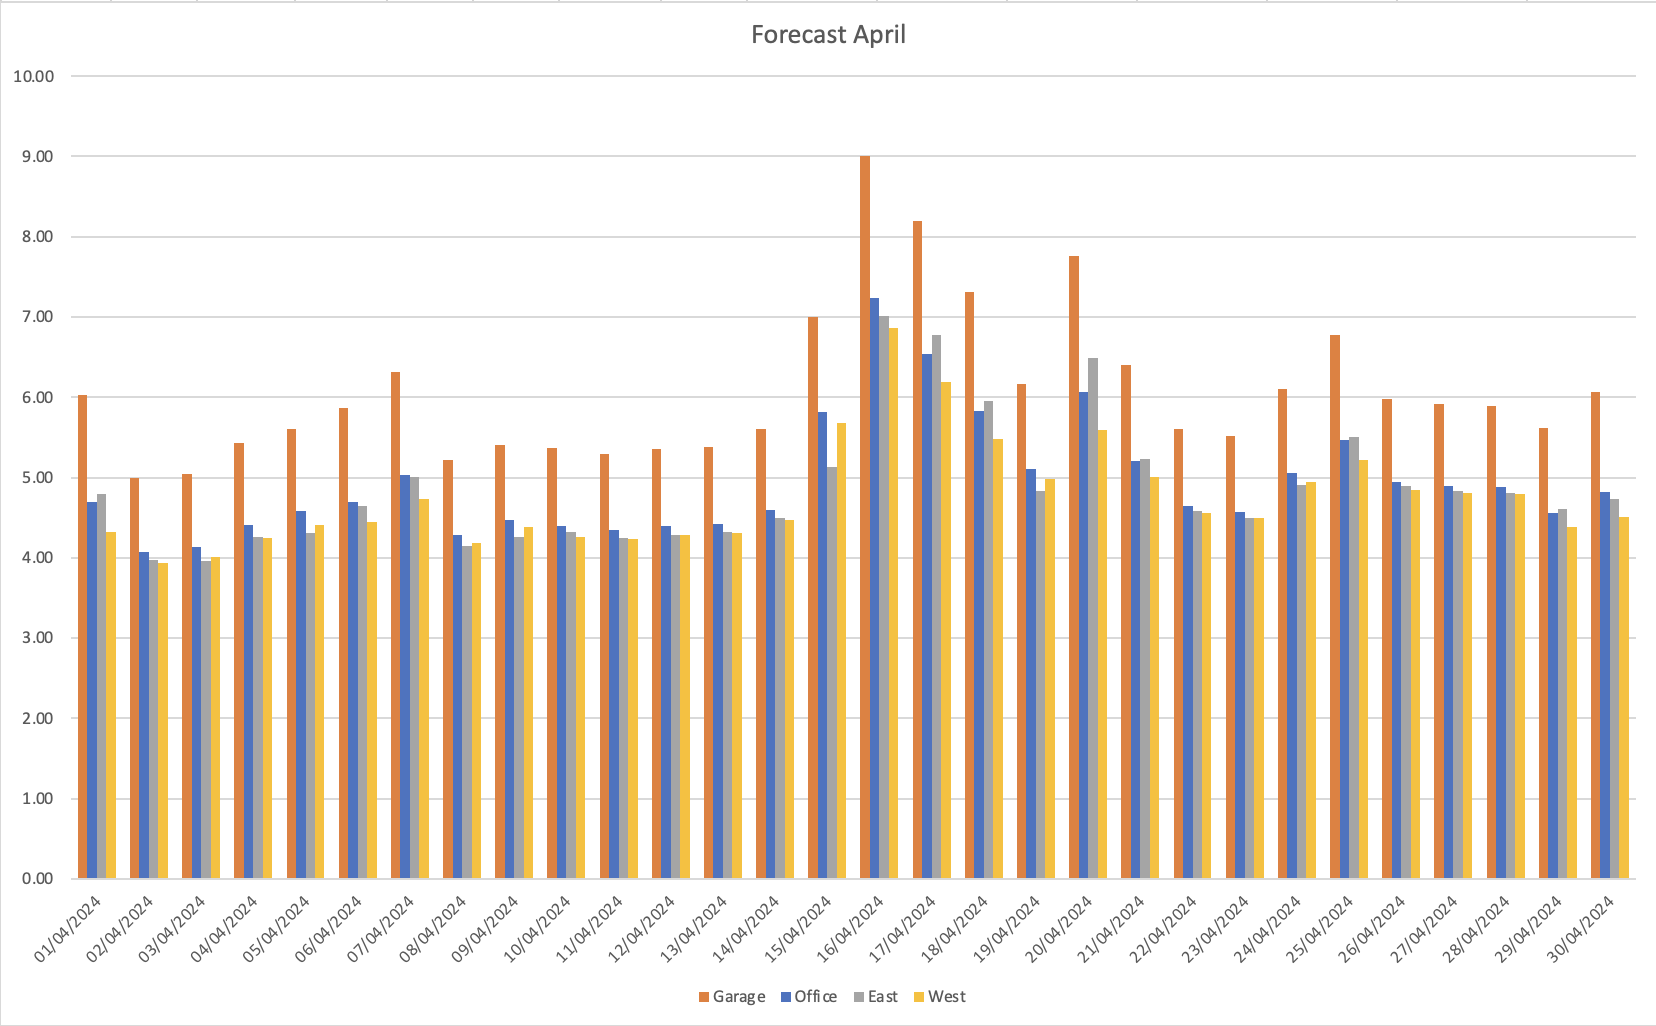
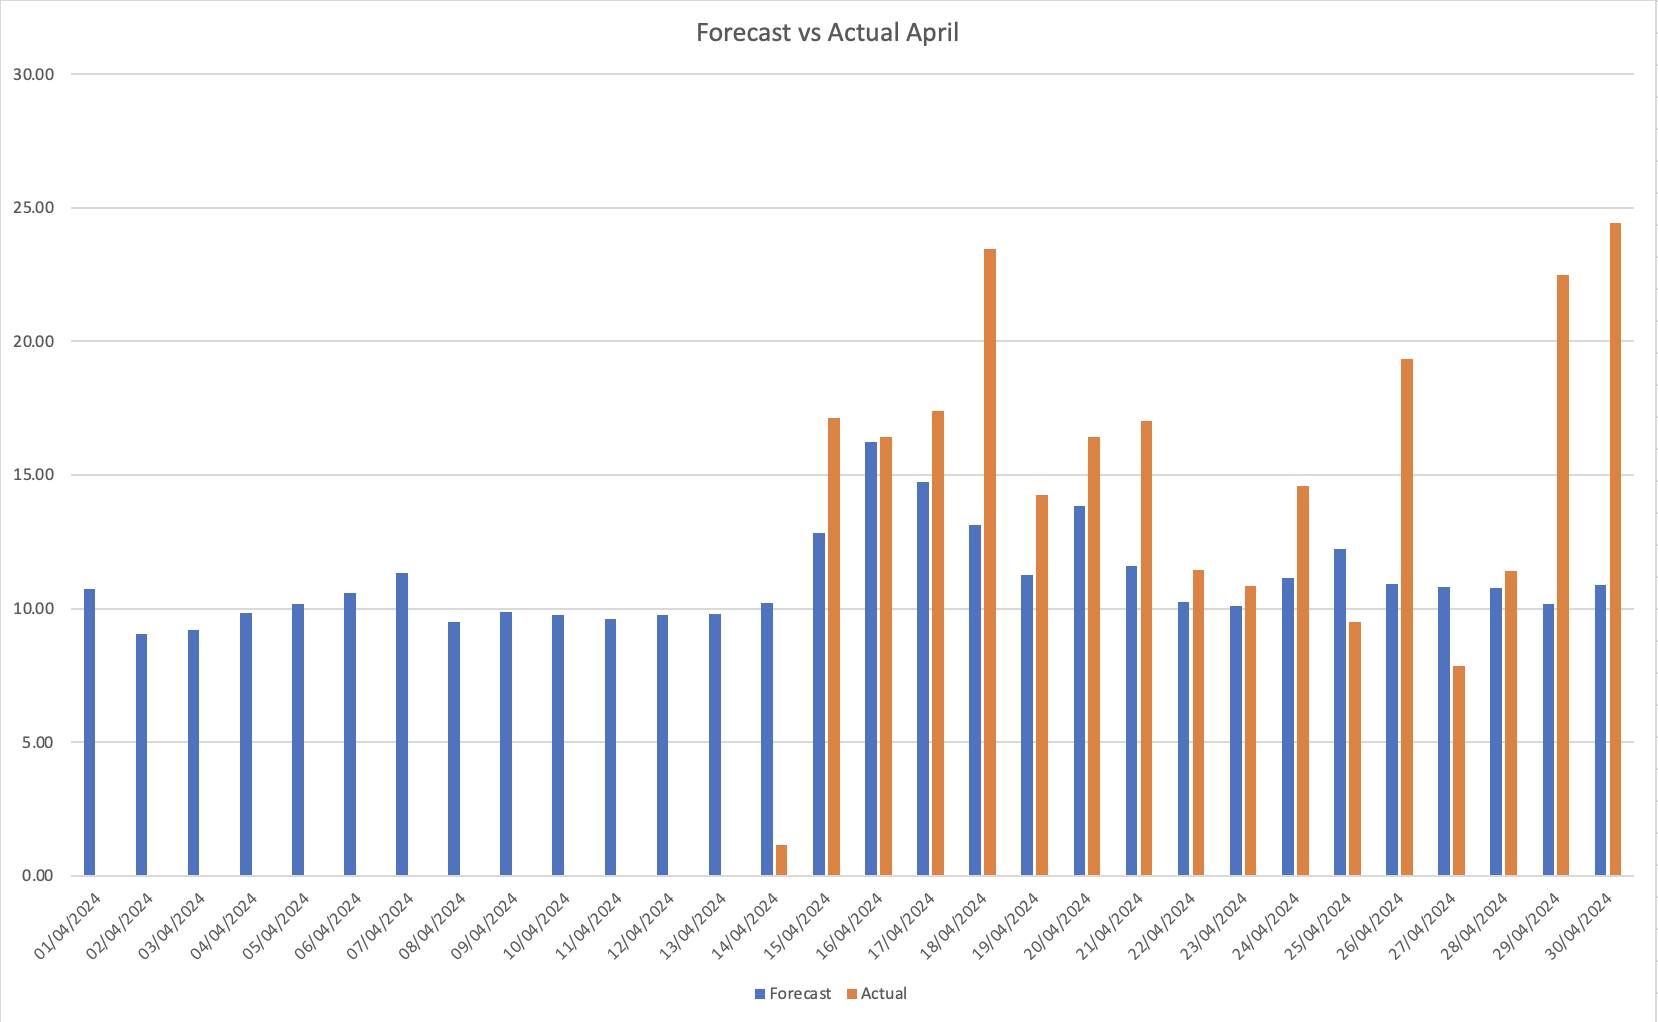
The first graph shows forecasted production for each of the 4 arrays, garage, office, east and west., I have not yet installed the east or west array, but I am capturing the forecast data in readiness.
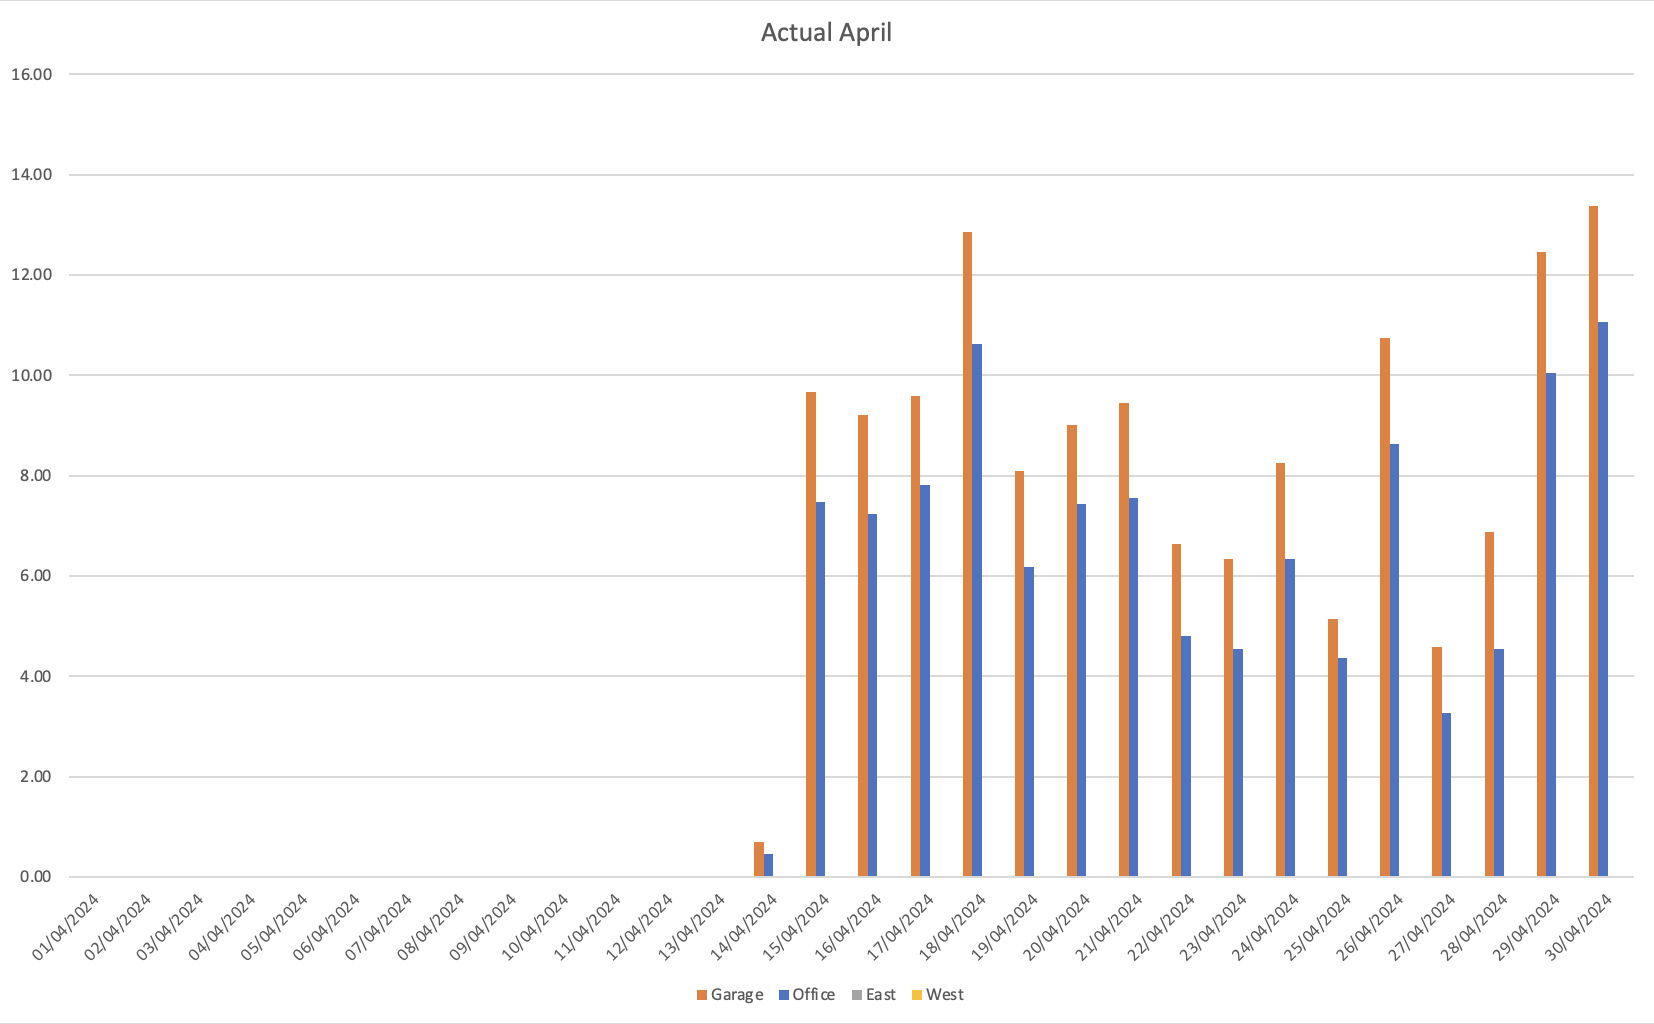
The Actual production data is shown for the garage and office arrays in the middle graph and then forecast compared to actual in the third graph for just these two arrays.
Some days I exceed the forecast estimate, on others I fall short, the forecast does not take my periodic shading into account as it assumes the panels remain unobstructed.
I am unsure how I manage to nearly double the estimate on some of the sunnier days, but then forecasting the weather in the UK is never very accurate and can have local anomalies.
The forecast data comes from Forecast.solar, via an API call, I download the forecast data on a daily basis for each array, I also use this data for live comparison within Home Assistant.