I have been generating yet more spreadsheets and graphs to track my energy usage in preparation for tracking the changes once I activate my solar and battery installation.
This post is being written in April after I have already commissioned the installation and is therefore the last month without solar or batteries.
This post will show the monthly graphs since the start of the year when I started with Octopus energy on January 4th having moved from E-ON.
I did not have any detailed bills from E-ON, so the graphs start from the 4th January with my Octopus Energy readings.
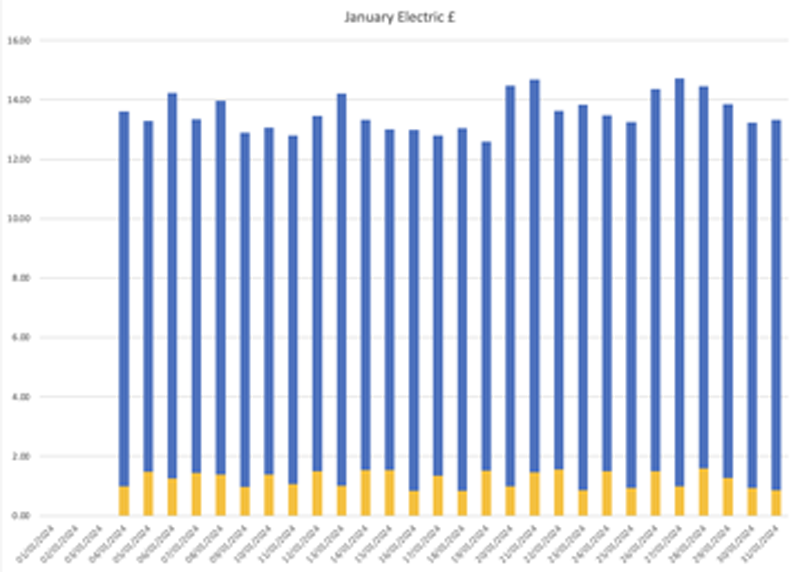
First the Electricity graphs, these show the split between peak and off-peak from both a consumption and cost point of view.
January Electric
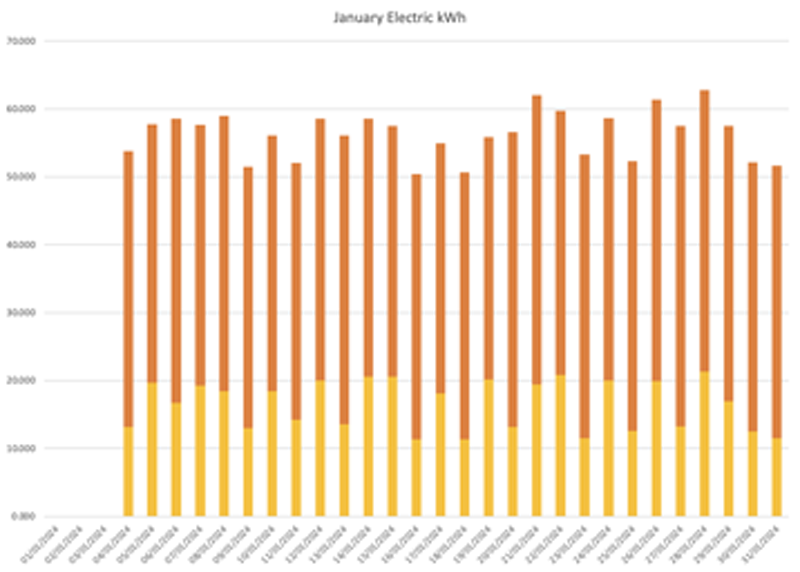
The fluctuations in off-peak usage are the days where my car is charged on the off-peak electric overnight
The cost chart shows that this has minimal impact on the overall cost for the day, despite being a reasonably significant increase in off-peak usage of an extra 8kWh.
Average usage: off-peak 16.48kWh, peak 39.75kWh, total 56.23kWh
Average costs: off-peak £1.24, peak £12.33, total £13.99 (including standing charge of £0.4201)
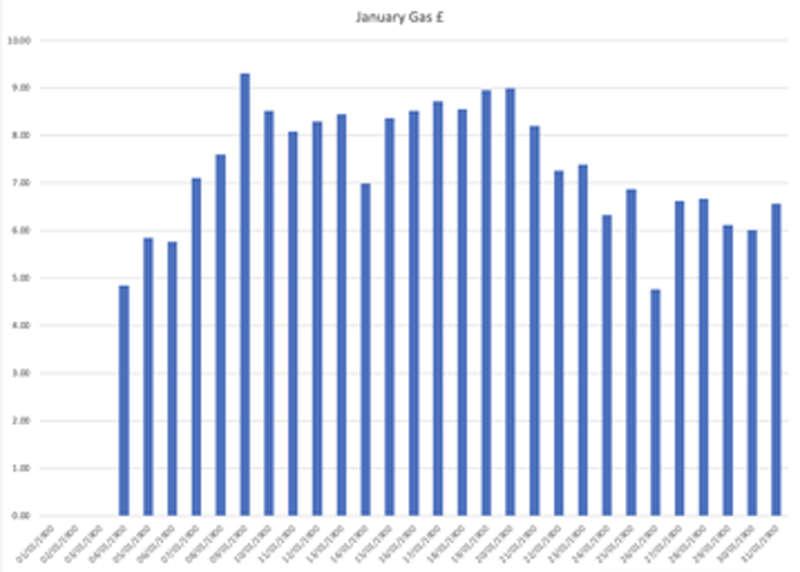
January Gas
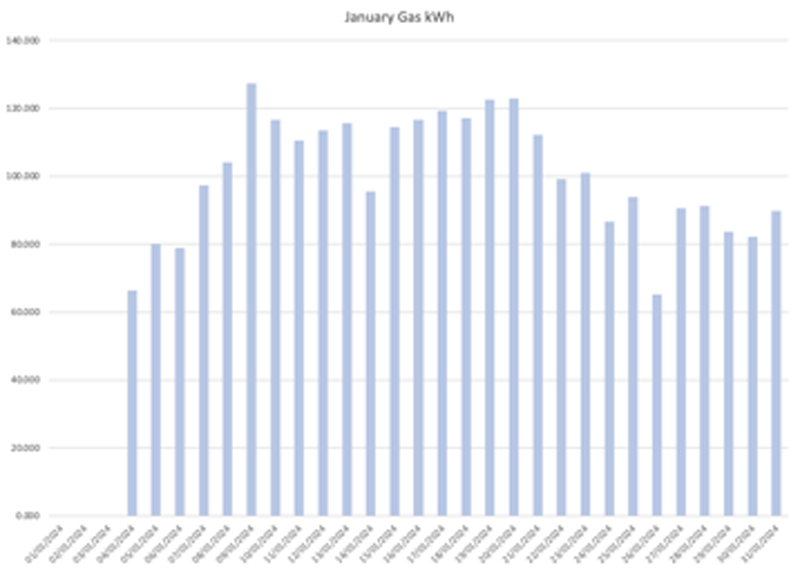
Gas usage in January varies based on how cold it is on a given day and how many showers people are having, I should possibly consider having another chart that shows the daily temperatures next to this one.
Average usage: 100.50kWh
Average cost: £7.62 (including standing charge of £0.2747)
Total daily energy average cost for January: £21.61 (including standing charges of £0.6948)
Total costs for January were £34.60 off-peak, £345.39 peak, £205.69 gas, £607.23 overall (including standing charge of £21.53).
January 2023 costs were £101.55 off-peak, £616.17 peak, £367.37 gas, £1,1242.49 overall (including standing charge of £19.56).
Significant savings across the board with a 50% overall saving.
January costs for 2024 using Dec 2023 E-ON tariffs £57.95 off-peak, £387.69 peak, £181.80 gas, £636.04 overall (including standing charge of £19.56).
So the practical saving was £28.81 vs staying on my old E-ON tariffs.
February Electric
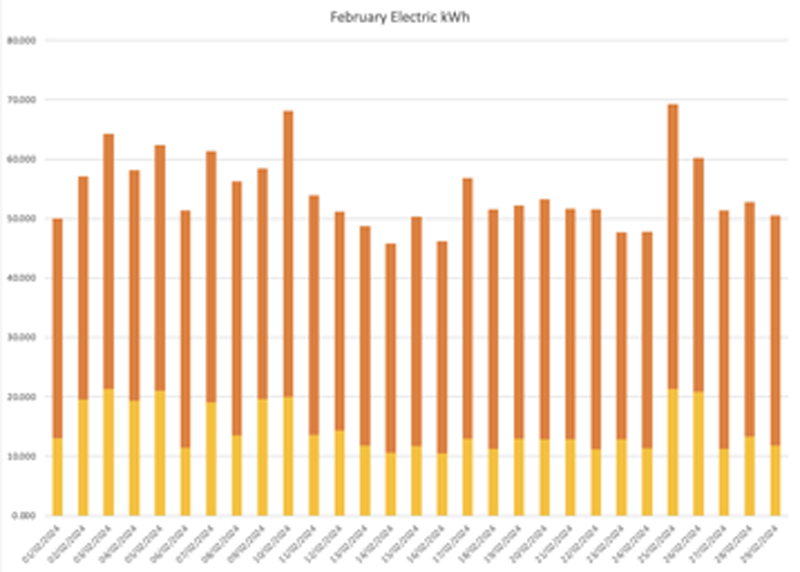
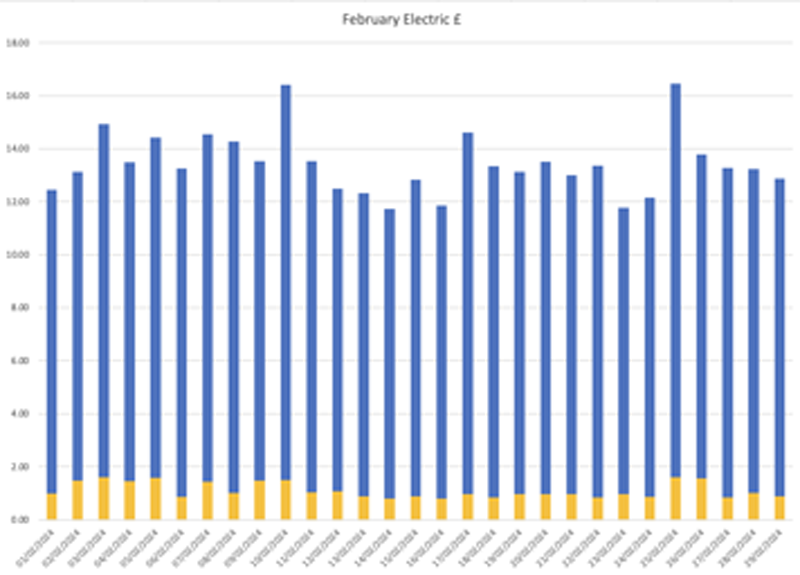
More of the same, nothing much of note, enjoying the savings that I am making compared to my previous E-ON tariffs.
Average usage: off-peak 14.77kWh, peak 39.75kWh, total 54.52kWh
Average costs: off-peak £1.11, peak £12.33, total £13.86 (including standing charge of £0.4201)
February Gas
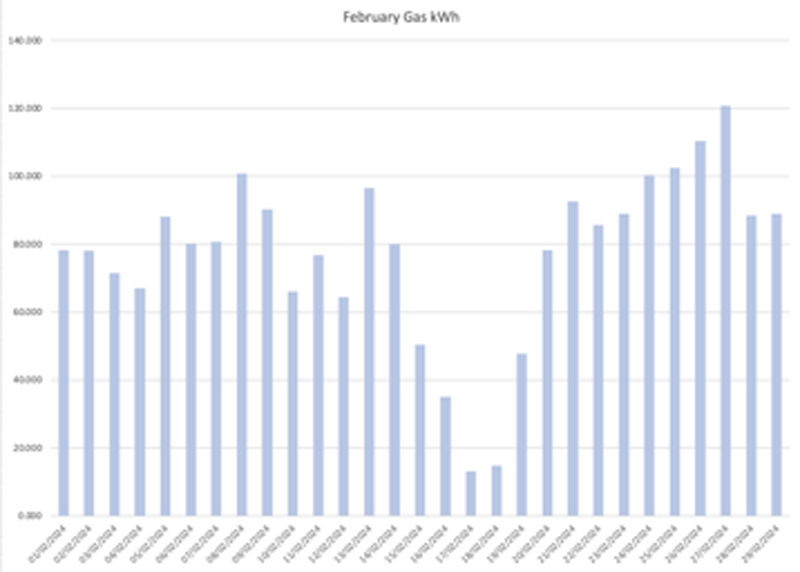
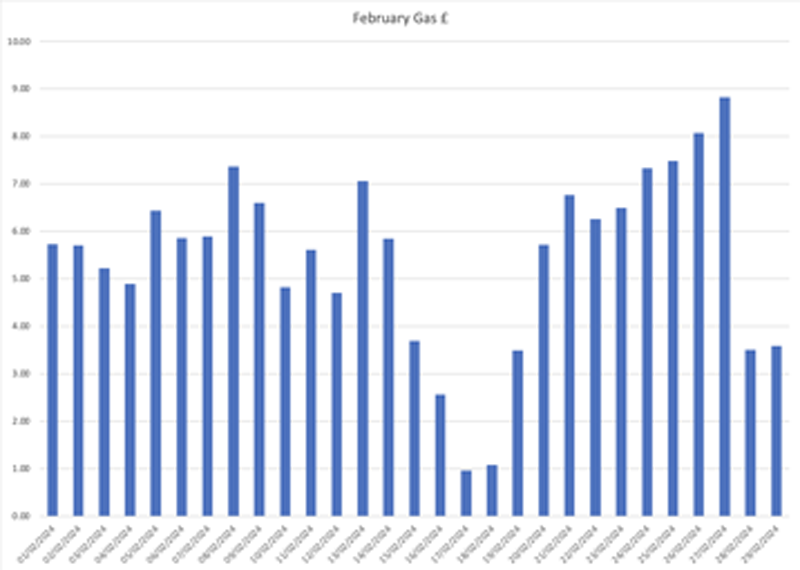
The dip on 17th and 18th is due to me turning the heating off for those days as it had been milder temperature wise, but I then turned it back on as it was ultimately a little too soon for this.
At the end of February I also changed my gas tariff from the standard Flexible Octopus tariff to the Octopus Tracker tariff where the price varies every day.
The daily price could potentially go as high as its cap of £0.30/kWh, however typically it is less than £0.05/kWh, which is still 30% less than the £0.731/kWh on Flexible Octopus.
Prices for the tracker tariffs can be seen on the mysmartenergy site, where tomorrow’s price and all historical daily prices can be seen for both gas and electric.
The tracker tariff kicked in on the 28th and can be seen as a significant drop from the previous days.
Average usage: 77.10kWh
Average cost: £5.43 (including standing charge of £0.2747)
Total daily energy average cost for February: £19.57 (including standing charges of £0.6948).
Total costs for February were £32.12 off-peak, £357.72 peak, £158.31 gas, £567.60 overall (including standing charge of £20.14).
February 2023 costs were £91.72 off-peak, £590.39 peak, £331.82 gas, £1031.93 overall (including standing charge of £18.00).
Again 50% savings compared to 2023.
February costs for 2024 using Dec 2023 E-ON tariffs £53.78 off-peak, £401.53 peak, £144.47 gas, £599.78 overall (including standing charge of £18.00).
So the practical saving was £39.94 vs staying on my old E-ON tariffs.
Significant savings across the board with a 50% overall saving.
March Electricity
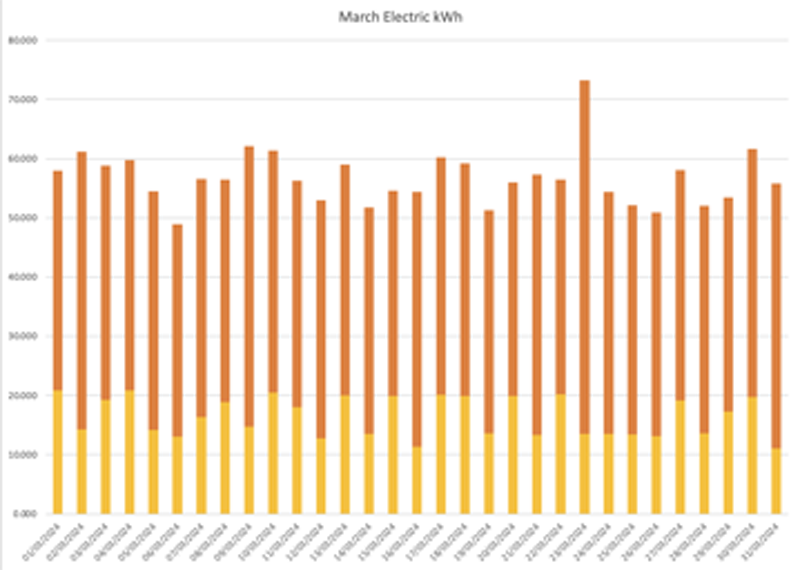
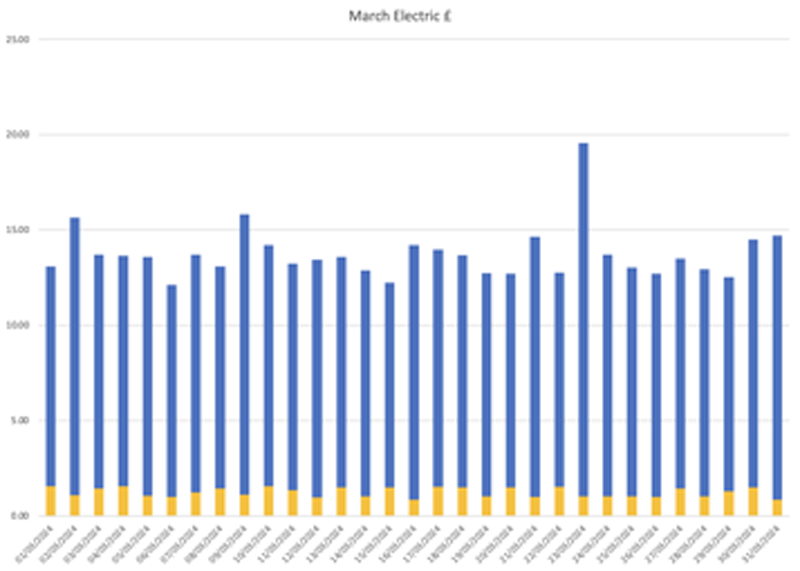
Electricity usage was up slightly from February mainly due to an increased number of days where the car was charged.
Average usage: off-peak 16.46kWh, peak 40.29kWh, total 56.74kWh
Average costs: off-peak £1.23, peak £12.50, total £14.15 (including standing charge of £0.4201)
March Gas
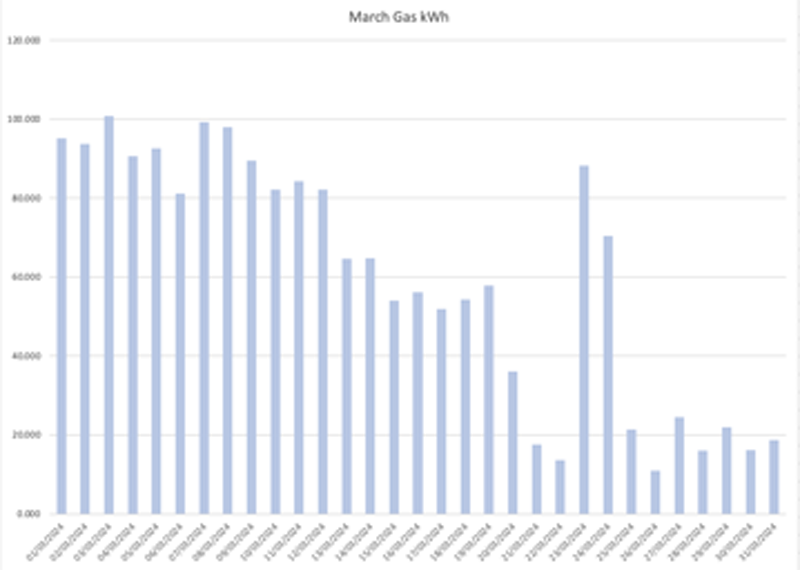
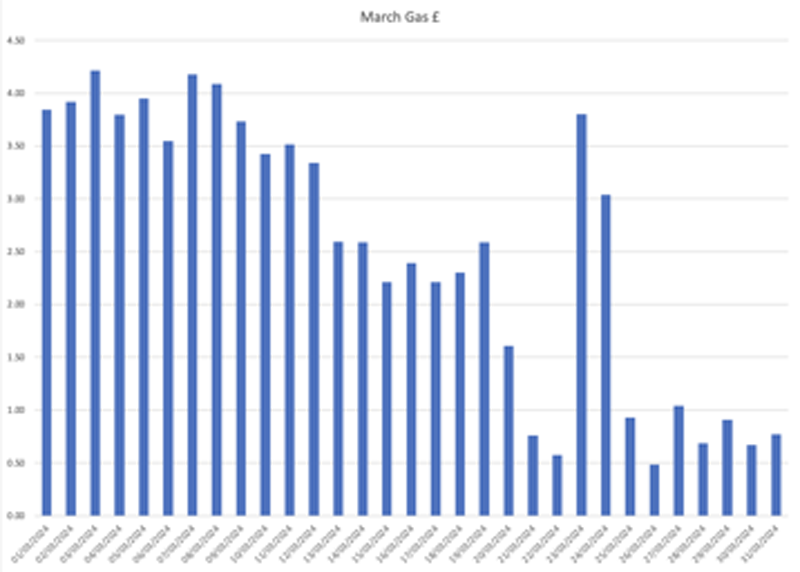
The basic trend here is downwards as the temperatures improve, heating is once again turned off on 21st to 22nd, on again for 23rd and 24th when the temperature dropped agin, then finally turned off on 25th.
Average usage: 59.65kWh
Average cost: £2.78 (including standing charge of £0.2747)
Total daily energy average cost for March: £16.94 (including standing charges of £0.6948).
Total costs for March were £38.26 off-peak, £387.53 peak, £78.03 gas, £525.36 overall (including standing charge of £21.53).
March 2023 costs were £81.46 off-peak, £583.89 peak, £355.07 gas, £1040.35 overall (including standing charge of £19.56).
A third month of 50% savings compared to 2023.
March costs for 2024 using Dec 2023 E-ON tariffs £64.07 off-peak, £434.99 peak, £119.46 gas, £627.12 overall (including standing charge of £19.56).
So the practical saving was £101.76 vs staying on my old E-ON tariffs.
Daily average costs down by around 25% from January to March, mostly due to savings on the new gas tariff, even more so now that the heating has been turned off and daily gas costs are under £1.00 purely for heating the hot water.
I heat my hot water with an ‘always on’ schedule to avoid people potentially having cold or luke warm showers, this happened a few times when I had a ‘twice a day’ schedule in place and 3 or more people had a morning shower.
I am unconvinced I would make any significant savings by returning to a ‘twice a day’ schedule.
My incremental ‘top off’ costs are around 0.4kW per hour (£0.016), and around 3.3kW (£0.132) following a shower for my 210 litre MegaFlo tank.
The potential grief from someone experiencing a cold shower is just not worth it to possibly save £0.10-£0.20 a day.
I may as an experiment put the hot water on a ‘twice a day’ schedule again for a day or two, just to see what the actual costs are for heating twice and then allowing the tank to ‘cool’ in-between for a comparison.
I did purchase a Myenergi Eddi to use as a solar diverter and I will fit it along with a second heating element to my MegaFlo tank, although for any kind of return on investment on this, I would need to completely remove the gas supply including the standing charge and be heating purely from solar, as even heating the hot water from the battery or off-peak at £0.075/kWh is significantly more expensive than heating it from gas at an average cost of £0.04/kWh.