This is the seventh full month with the solar being active.
Energy prices remained the same for this month, although there was 1 ‘Free Electricity’ event during the month.
November Electric:
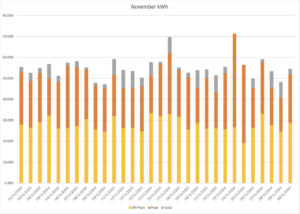
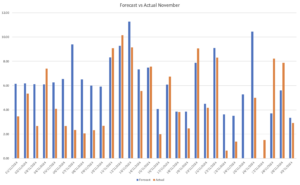
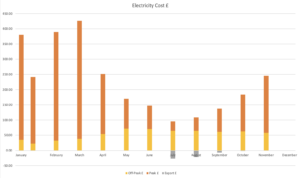
The average daily consumption, including solar, for the month of November was 55.17kWh, solar production was pretty poor with a low of 0.77kWh and a high of 10.11kWh.
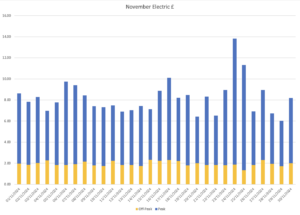
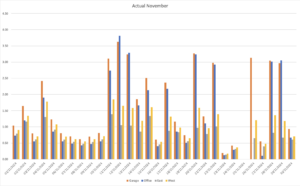
This in turn reflects quite visibly in the cost chart where we have a low of £4.31 and a high of £11.94 for peak electric usage (although some of this was actually ‘free’).
Most days were overcast/wet (or had a free electricity event) as they have much larger dark blue sections than previous months, the see-saw/sawtooth pattern for the Off-Peak is again largely due to whether or not the car was charged that night.
The average peak to off-peak percentage usage for the month was 45.19%, mainly because of the bad weather.
There is an abnormal amount of peak usage on the 25th because the main RCD tripped late on the 24th and I didn’t notice until late on the 25th when it was already dark.
Average usage: off-peak 27.77kWh, peak 23.34kWh, total 51.11kWh
Average costs: off-peak £1.94, peak £6.24, total £8.67 (including standing charge of £0.4557)
November Gas:
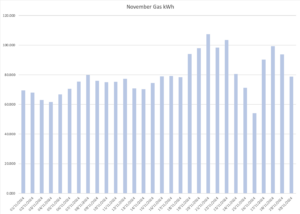
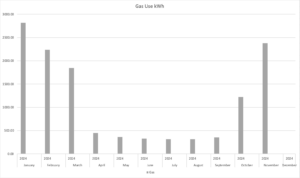
The heating was on for the entire month, highest gas usage was 107.41kWh and the lowest 61.67kWh – £6.47 and £3.54 respectively (including the standing charge of £0.2747).
Average usage: 79.32kWh, average gas tariff was £0.0583.
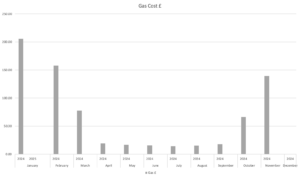
Average cost: £4.92 (including standing charge of £0.2747)
Total daily energy average cost for November: £13.69 (including standing charges of £0.7304).
Total costs for November were £58.31 off-peak, £187.09 peak, £147.58 gas, £407.60 overall (including standing charge of £22.95).
November 2023 costs were £51.09 off-peak, £406.77 peak, £119.23 gas, £574.56 overall (including standing charge of £20.82).
This is a 29% saving compared to 2023!
November costs for 2024 using Dec 2023 E-ON tariffs £104.63 off-peak, £243.91 peak, £162.07 gas, £510.60 overall (including standing charge of £31.37).
So the practical saving was £103.59 vs staying on my old E-ON tariffs.
I also had my SEG tariff and was able to export a total of 0.09kWh of electricity at £0.15 per kWh for a total saving of £0.01.
Not even worth bothering about.
I will again use the same assumption as always of 14.5kWh of battery, there were no days where I carried some battery charge to the next day.
So for this month, I have 30 days of solar production which means 14.5kWh x 30 days = 435.0kWh for the batteries that need to ‘swap’ from off-peak to peak rate.
I then produced 142.57kWh of solar, 0.09kWh of which was given back to the grid.
This means that the additional savings for having solar and batteries are (435.0kWh * (£0.2439 – £0.070)) + ((142.57-0.09)kWh) * £0.2439), = (435.0kWh * £0.1739) + (142.58kWh * £0.2439) = £85.76+ £38.09 = £123.85
Which in effect means that I have saved £123.85 + £103.59 + £0.01 = £227.46 compared to my old E-ON tariff and no solar/batteries for the month of November.
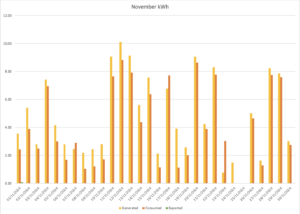
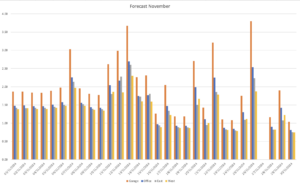
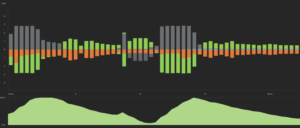
These are the graphs of forecast vs actual production:
Not sure why I collected no forecast data for the 27th, this has happened a few times now
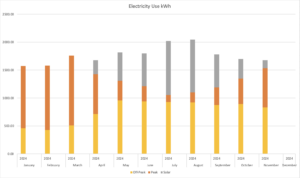
Month on month usage and cost graphs for 2024 (now including exports) for Electricity:
and the same for Gas:
The trend is continuing.
As mentioned at the start of this post, there was a ‘free electricity’ session during the month, where the ‘free’ element is any electricity you use, over and above your normal usage as viewed over the past 7-10 days during the hours in question, which this time was 07:00 – 09:00.
The session was on 24th of November, this then shows as additional usage on the electricity usage graphs for those days.
I only charged the batteries until 02:00, then allowed the house to run off them, with the intention of force discharging from 05:30 when the peak rate kicked in.
I woke up at about 05:00, saw the batteries were already down to about 40% so decided to charge them for an additional 30 minutes
I then force discharged between 05:30 and 07:00 prior to the event as I can only export at 4.2kW per hour (limited by DNO agreement), whereas I can charge at up to 9.6kW per hour (3.2kW per battery).
I then charged the batteries back to 100% between 07;00 and 09:00 which resulted in me using 18.6kW over and above my normal usage (0.00kW) which in turn equated to a saving of £4.99.
This saving can be combined with any exports for that day which included me ‘dumping’ to the grid of 6kW for further savings of £0.9 and a total saving of £5.89.
Unfortunately the main RCD tripped in the Solar sub panel at around 13:45, so some of these savings were then wiped out by being unable to charge the batteries that night and running off the grid 100% for around 36 hours.

