
This is the fourth full month with the solar being active.
Energy prices remained the same for this month, although there were 4 ‘Free Electricity’ events during the month – more on that later.
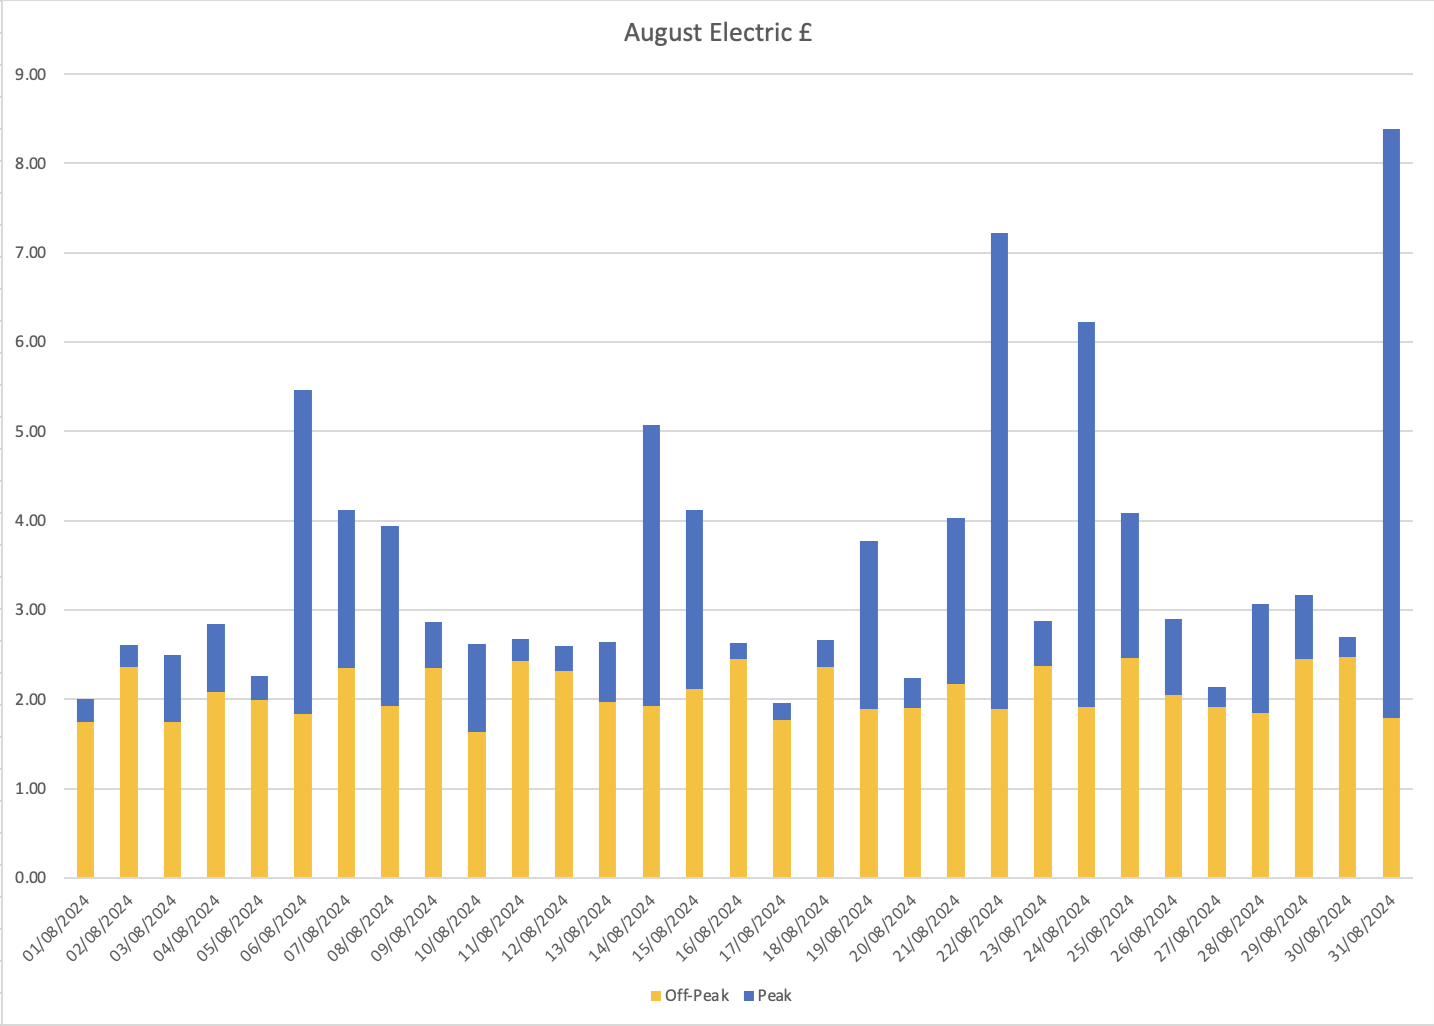
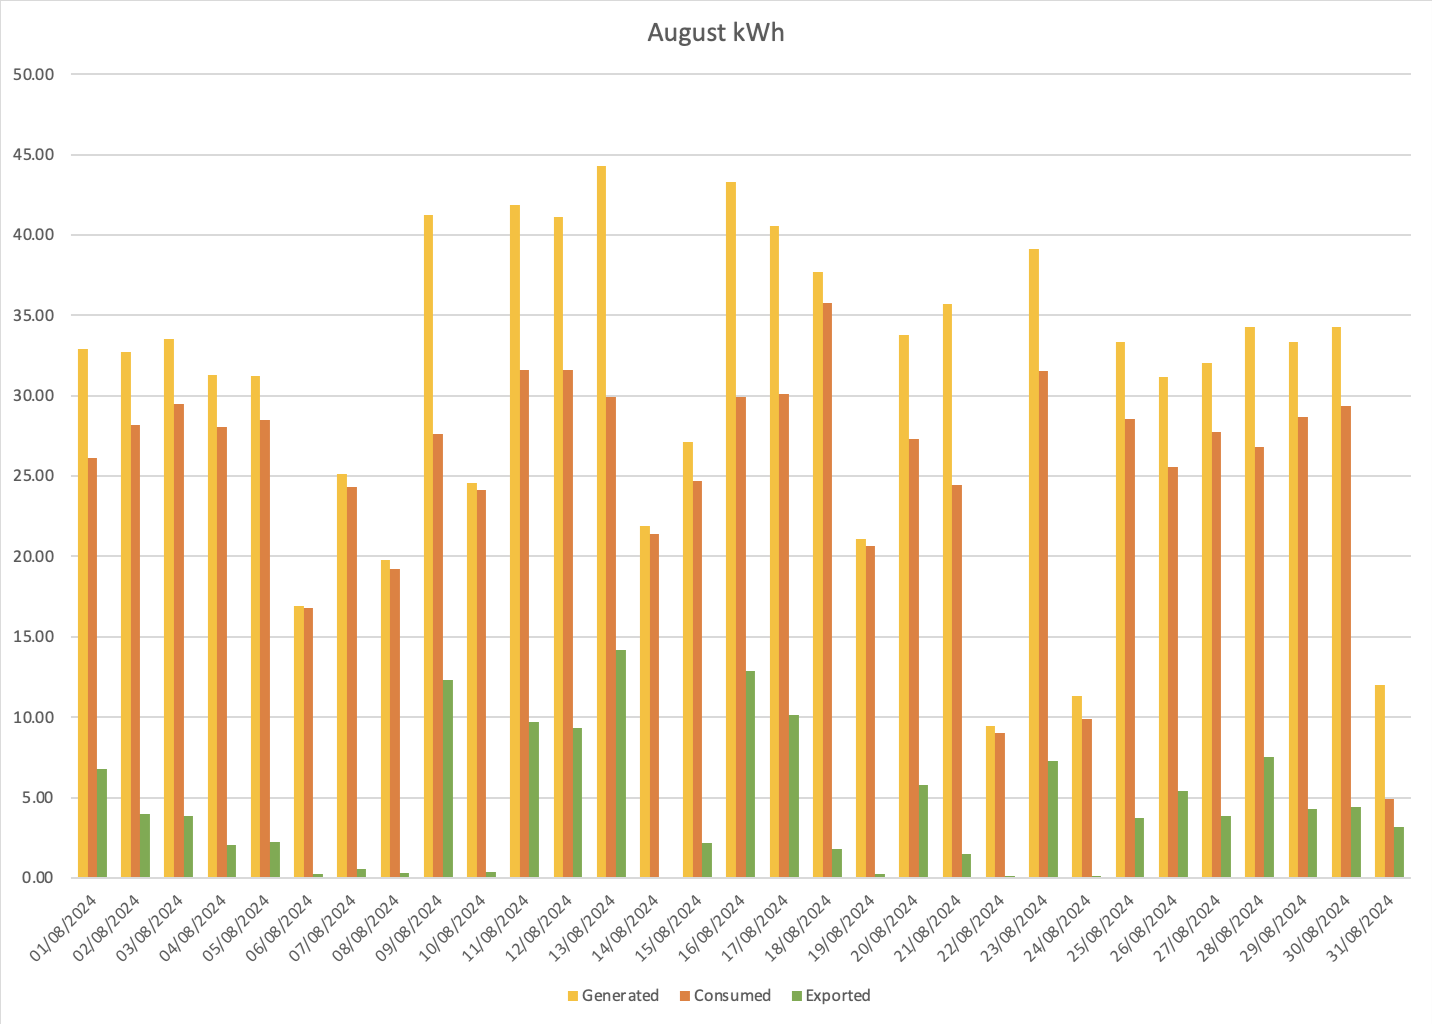
August Electric:
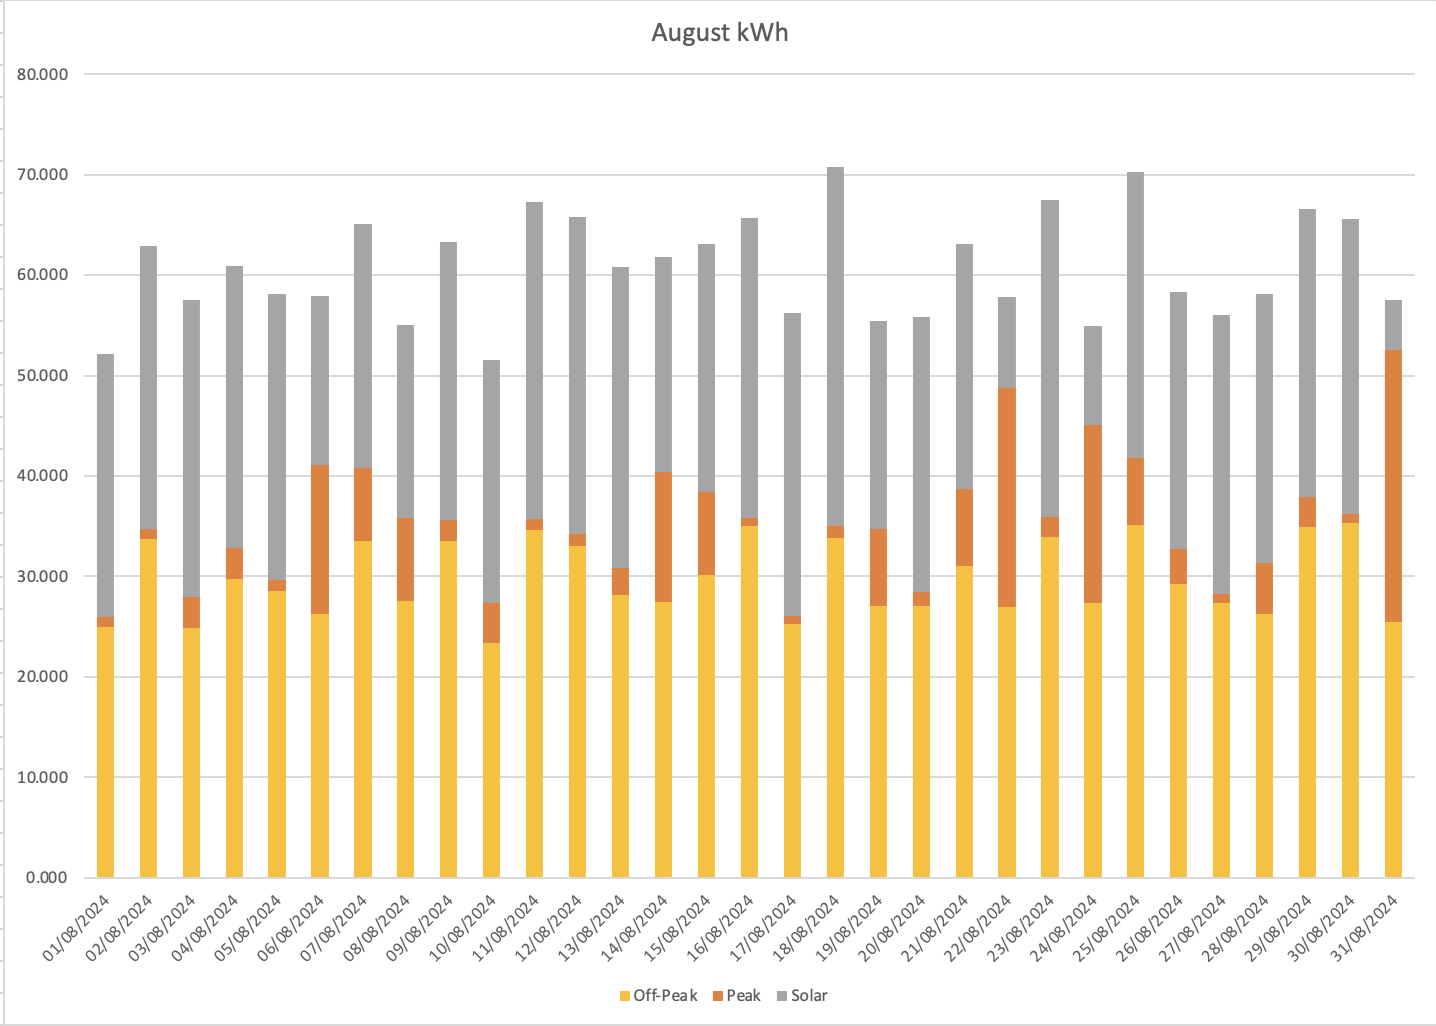
The average daily consumption, including solar, for the month of August was 60.73kWh, we have quite a large variation in solar production from a low of 9.42kWh up to a high of 44.27kWh.
This in turn reflects quite visibly in the cost chart where we have a low of £0.22 and a high of £6.60 for peak electric usage (although some of this was actually ‘free’).
It is easy to see from the Electricity cost graph which days were overcast/wet (or had a free electricity event) as they have much larger dark blue sections, the see-saw/sawtooth pattern for the Off-Peak is again largely due to whether or not the car was charged that night.
The average peak to off-peak percentage usage for the month was 14.52%, so maintaining the desired 25% or better reversal from pre solar, but skewed towards peak because of the ‘free electricity’ events.
Average usage: off-peak 29.71kWh, peak 5.81kWh, total 35.42kWh
Average costs: off-peak £2.08, peak £1.42, total £3.95 (including standing charge of £0.4557)
August Gas:
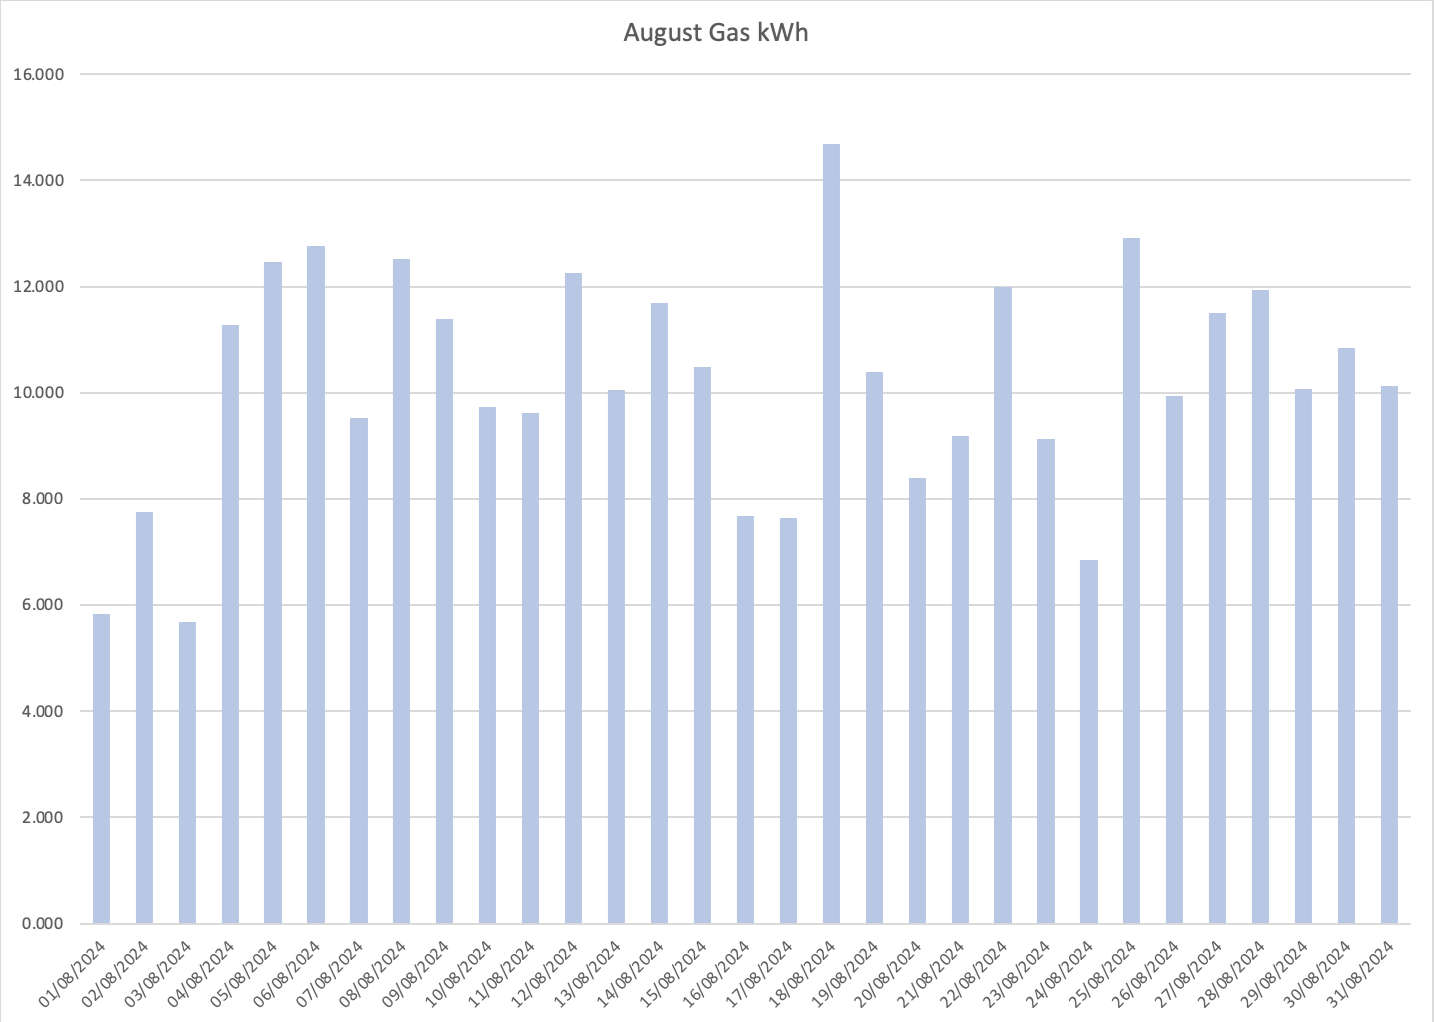
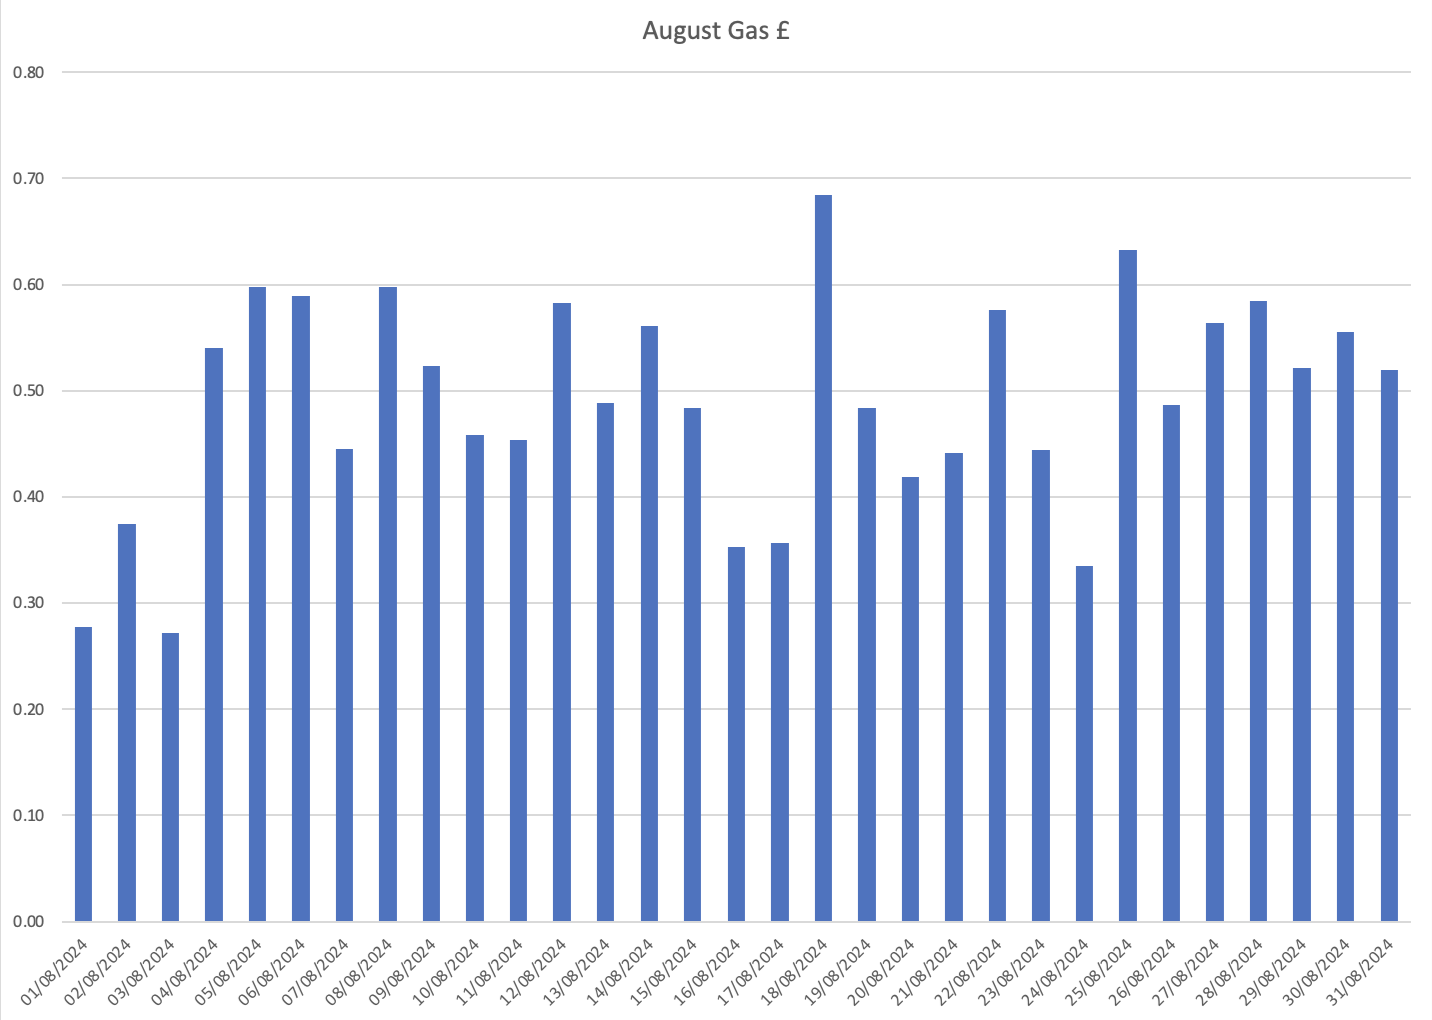
Once again the gas was off for the entire month, highest gas usage was 14.7kWh and the lowest 5.7kWh – £0.96 and £0.55 respectively (including the standing charge of £0.2747).
Average usage: 10.20kWh
Average cost: £0.76 (including standing charge of £0.2747)
Total daily energy average cost for August: £4.72 (including standing charges of £0.7304).
Total costs for August were £64.47 off-peak, £43.92 peak, £15.20 gas, £146.23 overall (including standing charge of £22.64).
August 2023 costs were £49.03 off-peak, £400.34 peak, £-815.29 gas, £-353.00 overall (including standing charge of £20.82).
(There was a substantial refund against July 2023 and then August 2023 for what I was paying for Gas)
Discounting the Gas (as the numbers are silly for 2023), this is a 75% saving for electricity alone compared to 2023!
August costs for 2024 using Dec 2023 E-ON tariffs £115.68 off-peak, £62.71 peak, £29.03 gas, £207.42 overall (including standing charge of £29.03).
So the practical saving was £60.47 vs staying on my old E-ON tariffs.
I also had my SEG tariff and was able to export a total of 140.23kWh of electricity at £0.15 per kWh for a total saving of £21.03
 Not as good as last month as we do not appear to be having the best of summers.
I will again use the same assumption as last month of 14.5kWh of battery, there were a few days where I carried some battery charge to the next day, but this was largely insignificant.
So for this month, I have 31 days of solar production which means 14.5kWh x 31 days = 449.5kWh for the batteries that need to ‘swap’ from off-peak to peak rate.
I then produced 948.04kWh of solar, 140.23kWh of which was given back to the grid.
This means that the additional savings for having solar and batteries are (449.5kWh * (£0.2439 – £0.070)) + ((948.04-140.23)kWh) * £0.2439), = (449.5kWh * £0.1739) + (807.81kWh * £0.2439) = £78.18 + £197.05 = £275.23
Which in effect means that I have saved £275.23+ £60.47 + £21.03 = £356.73 compared to my old E-ON tariff and no solar/batteries for the month of August.
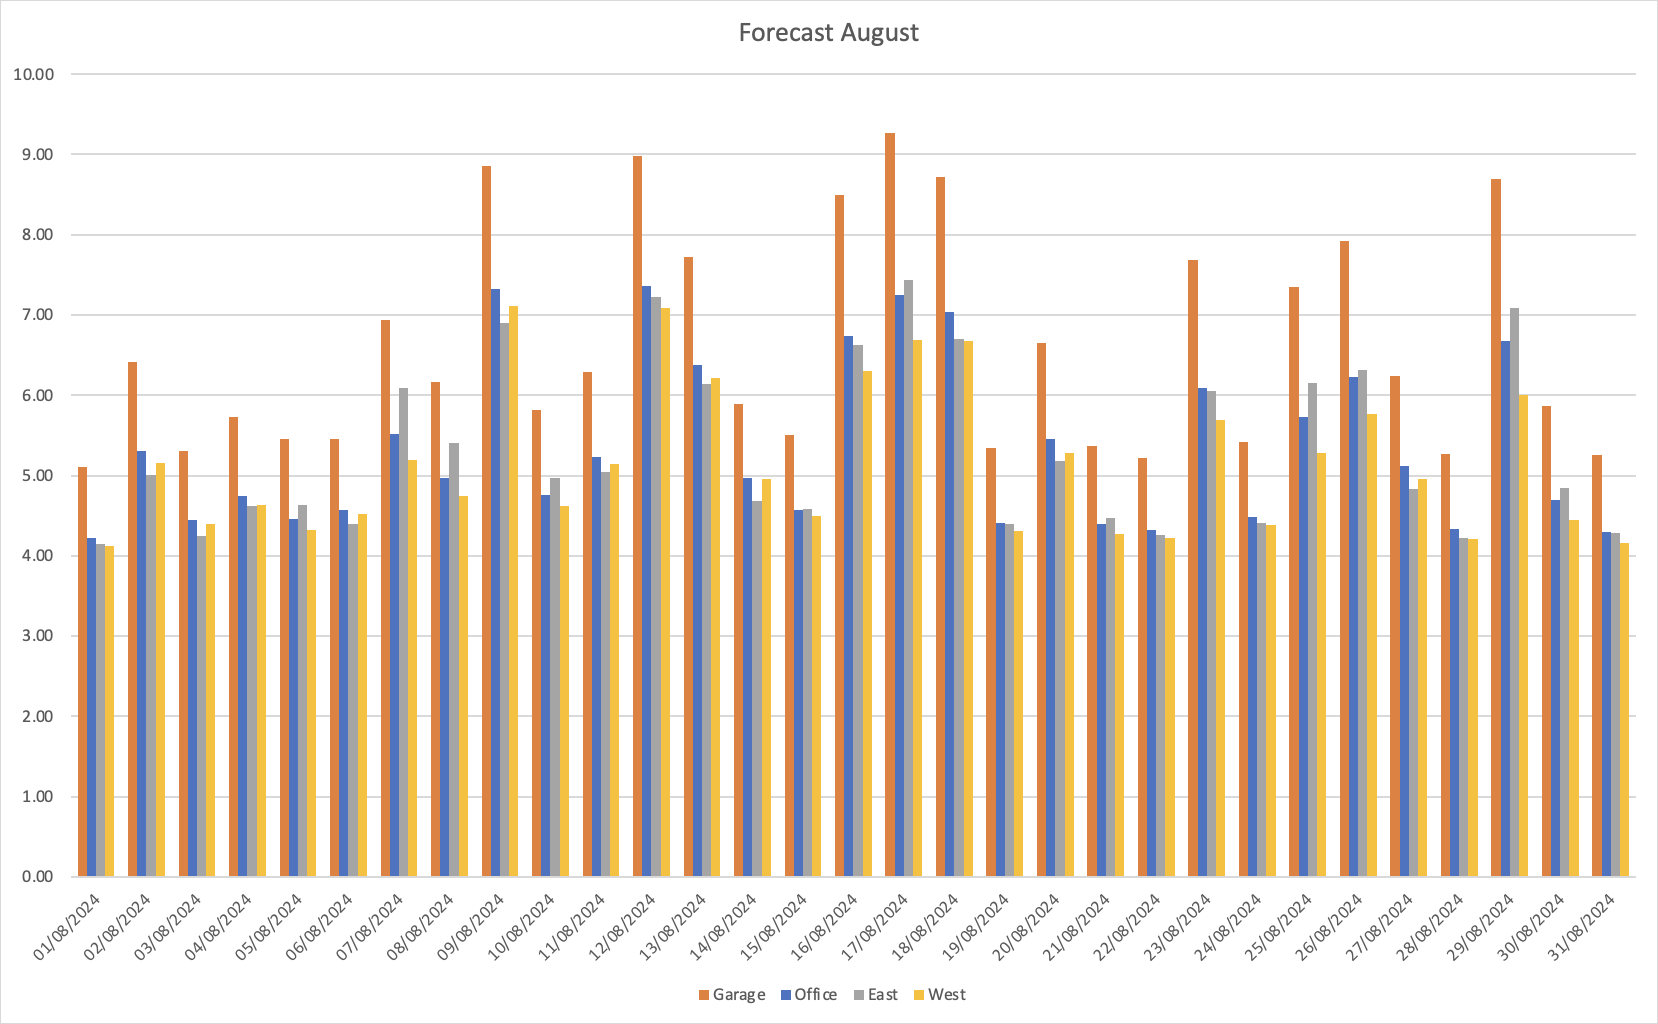
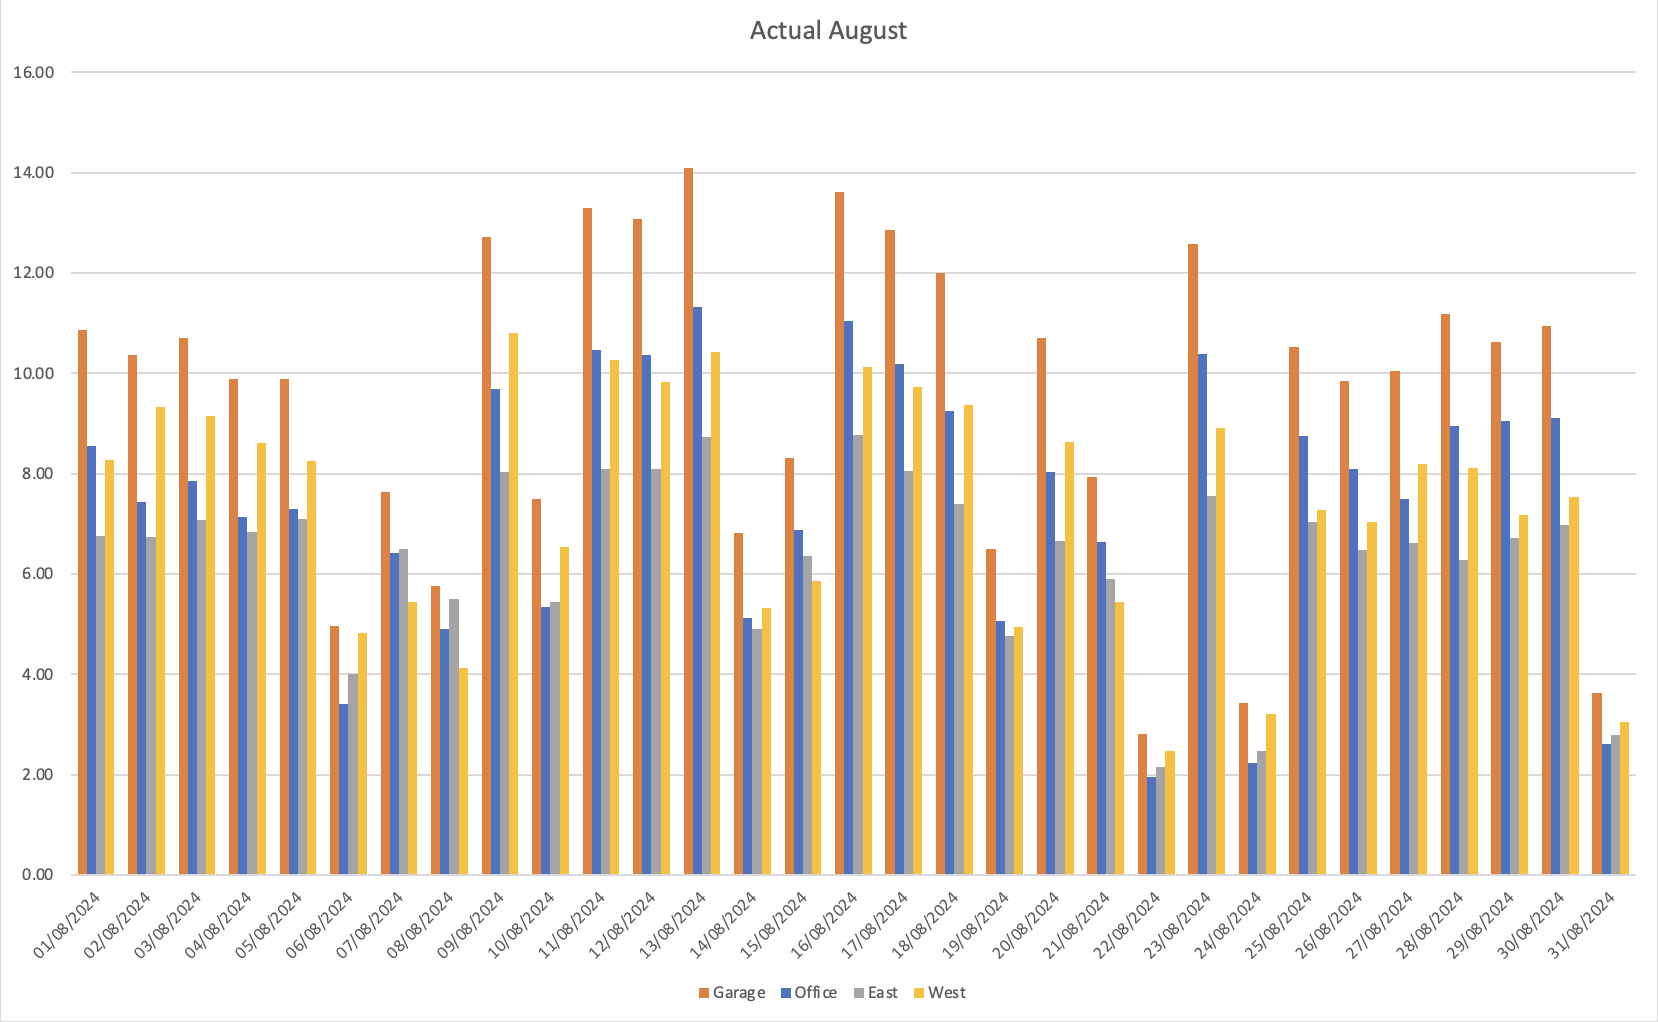
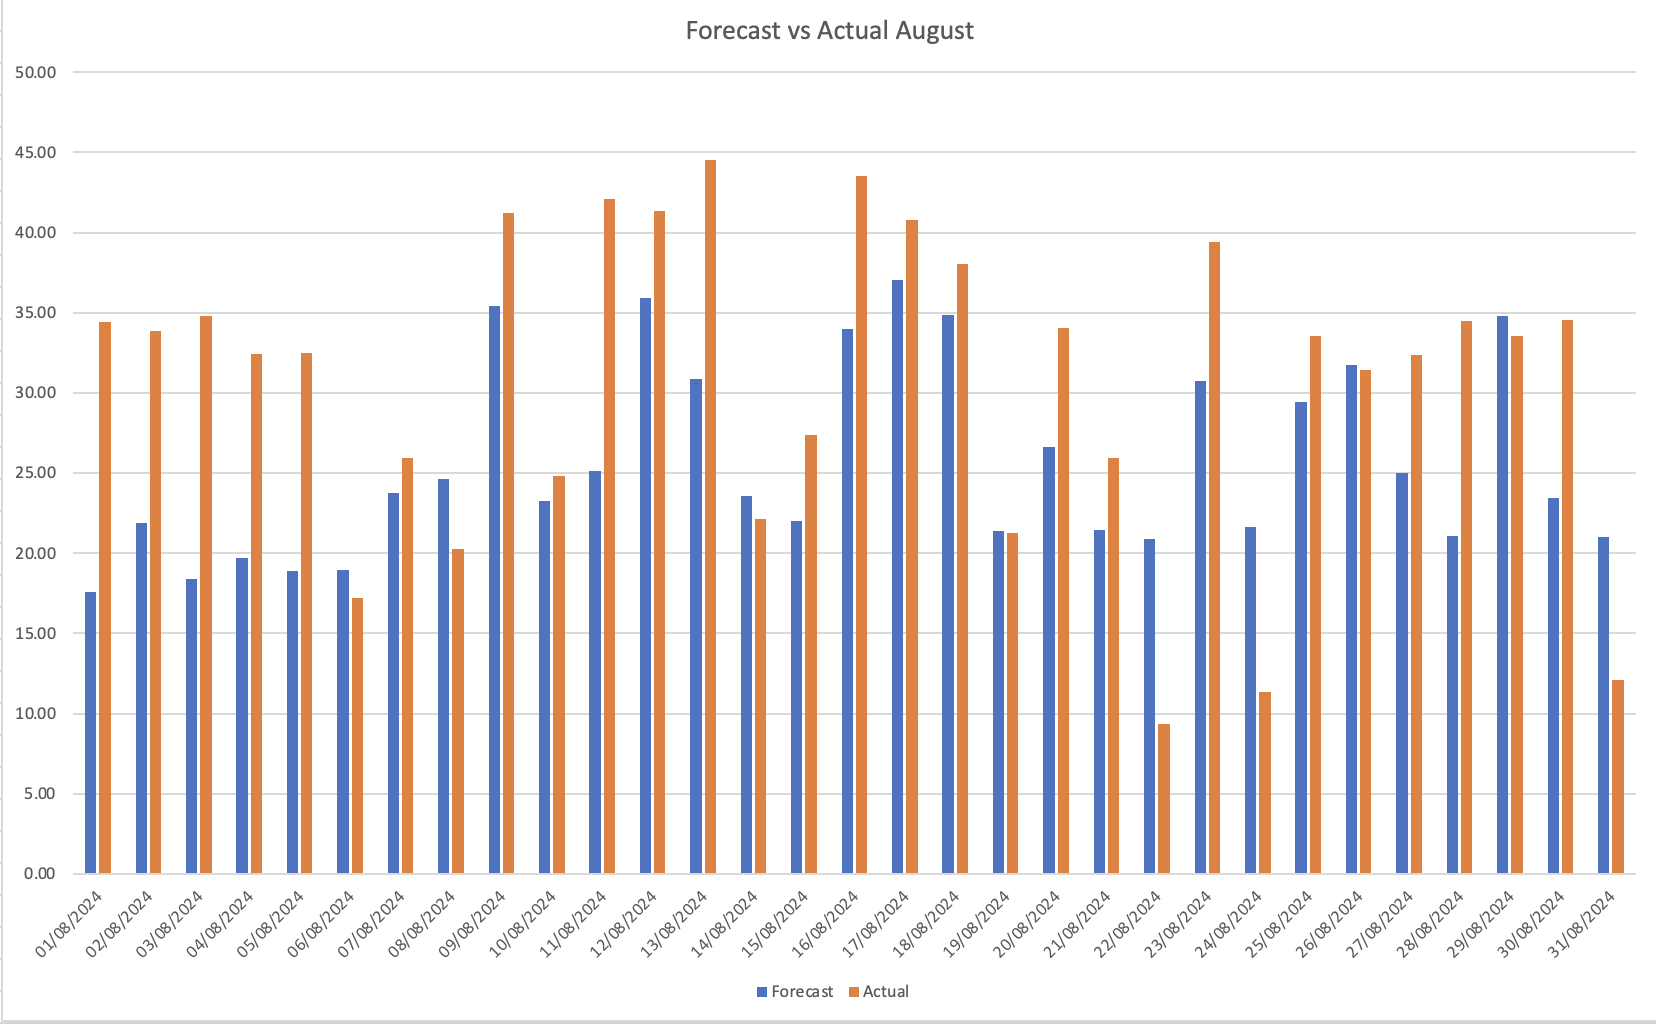
These are the graphs of forecast vs actual production:
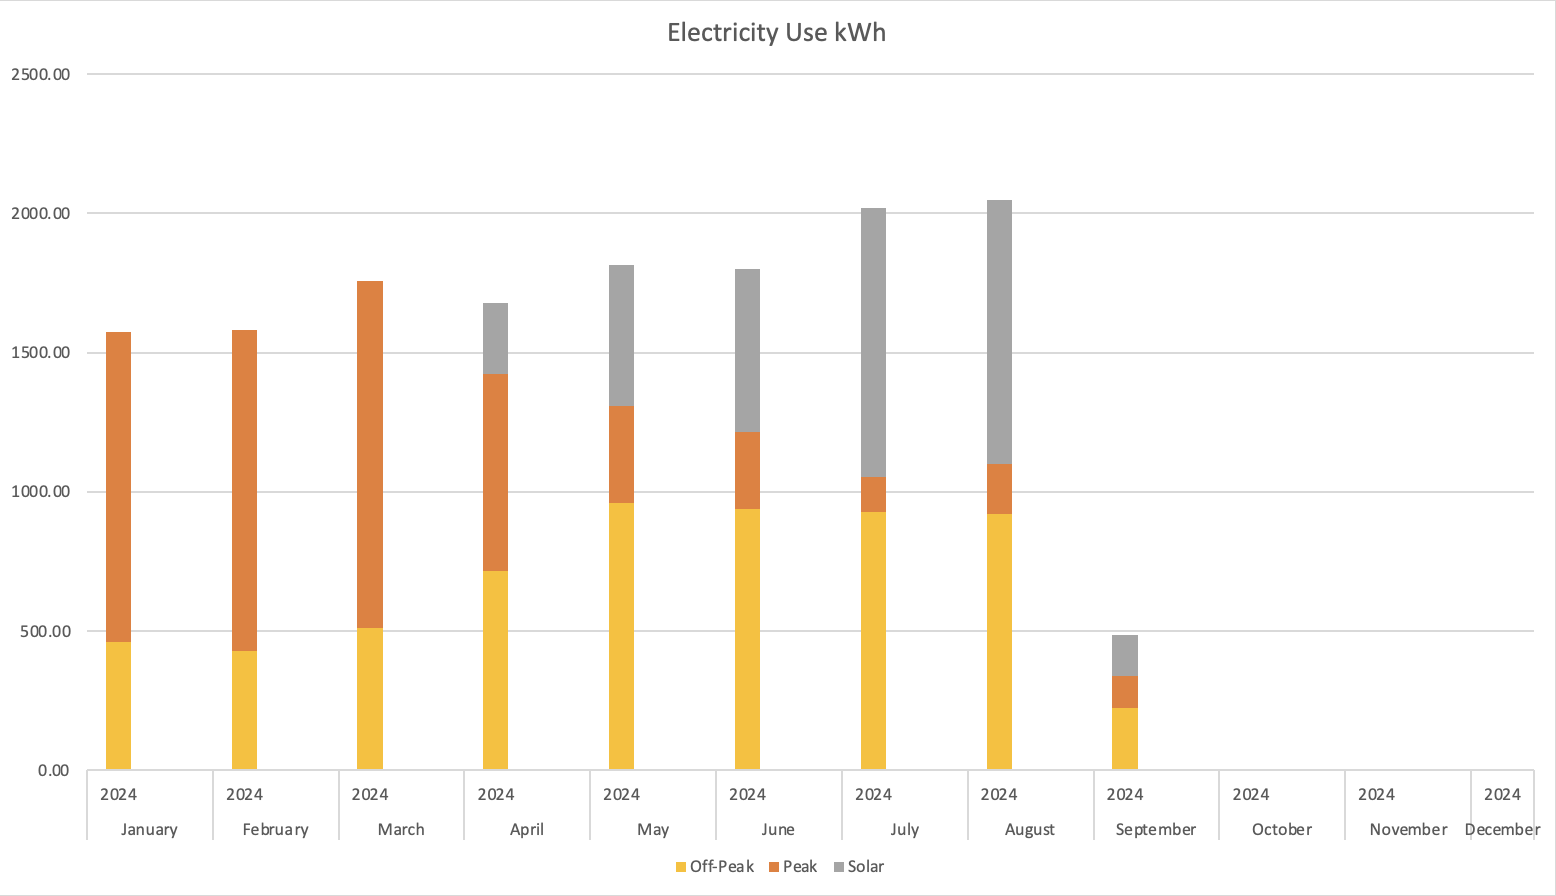
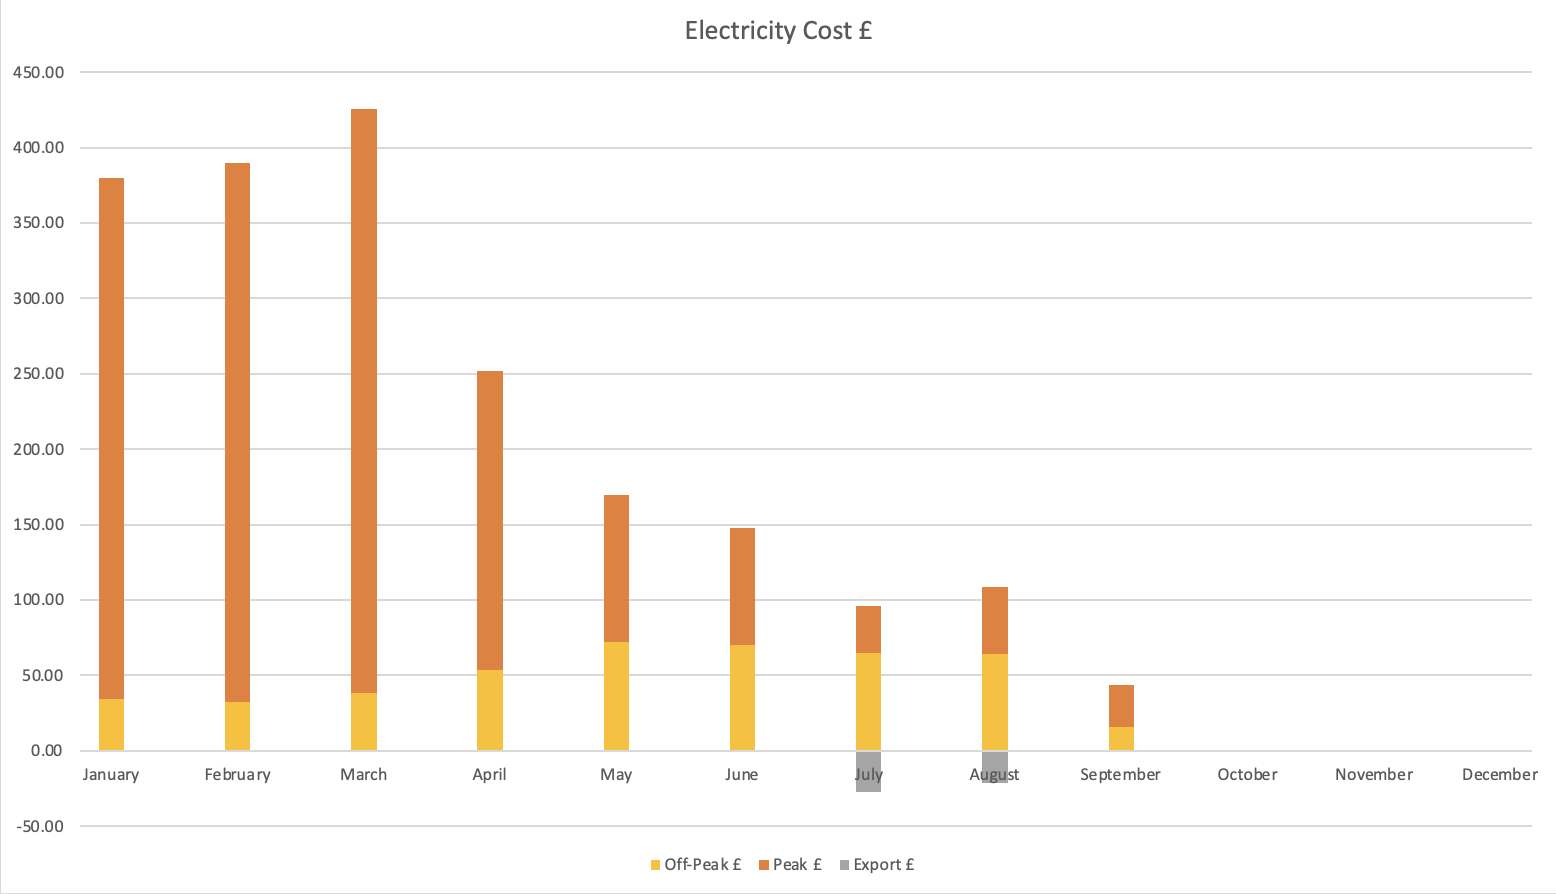
Month on month usage and cost graphs for 2024 (now including exports) for Electricity:
and the same for Gas:
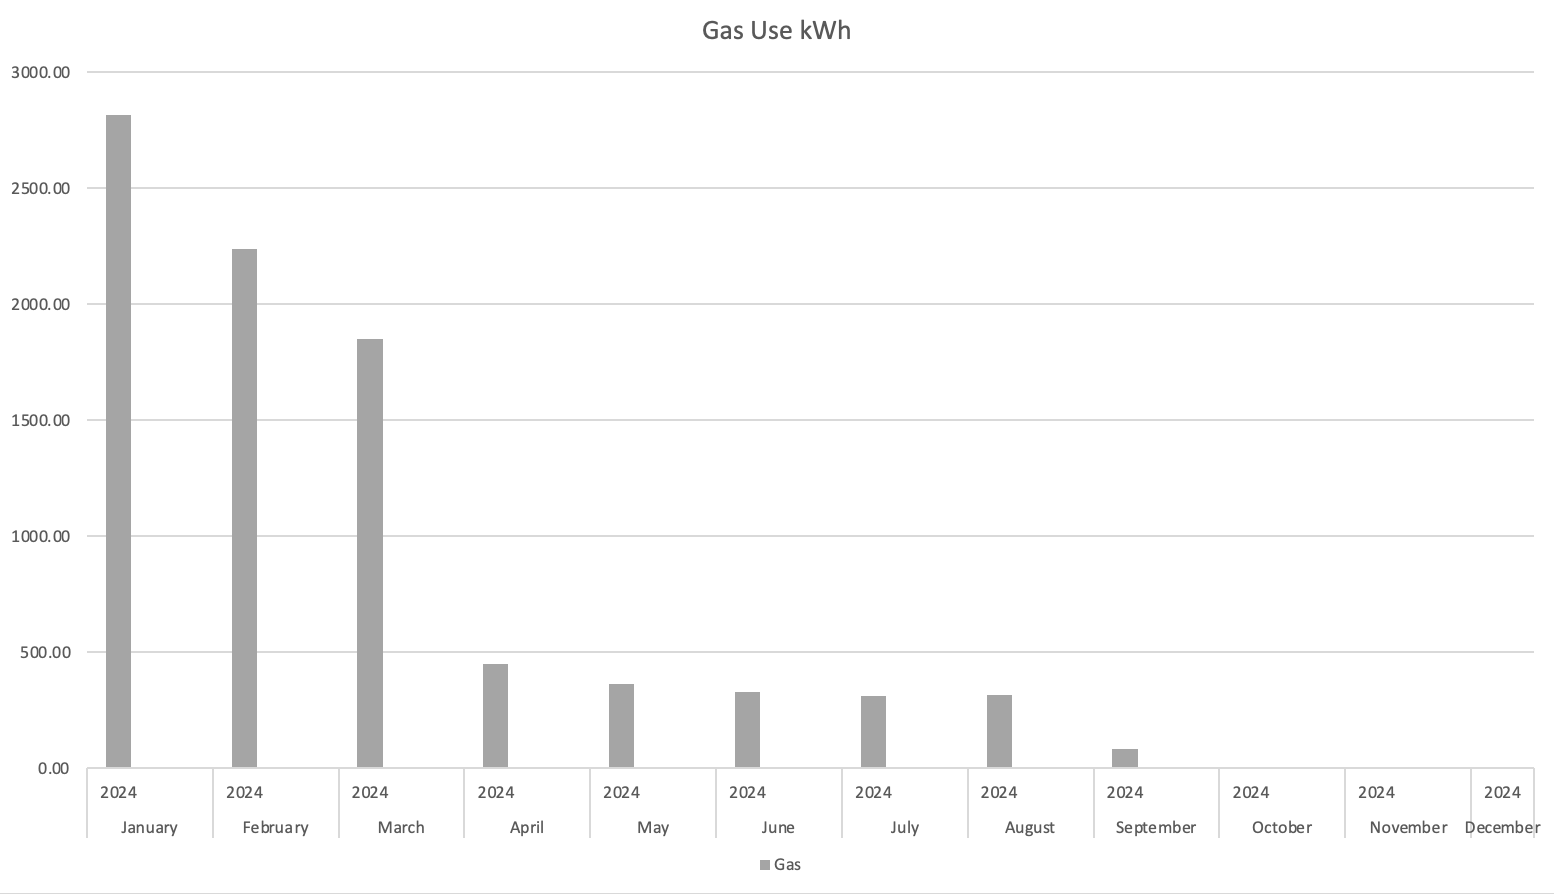
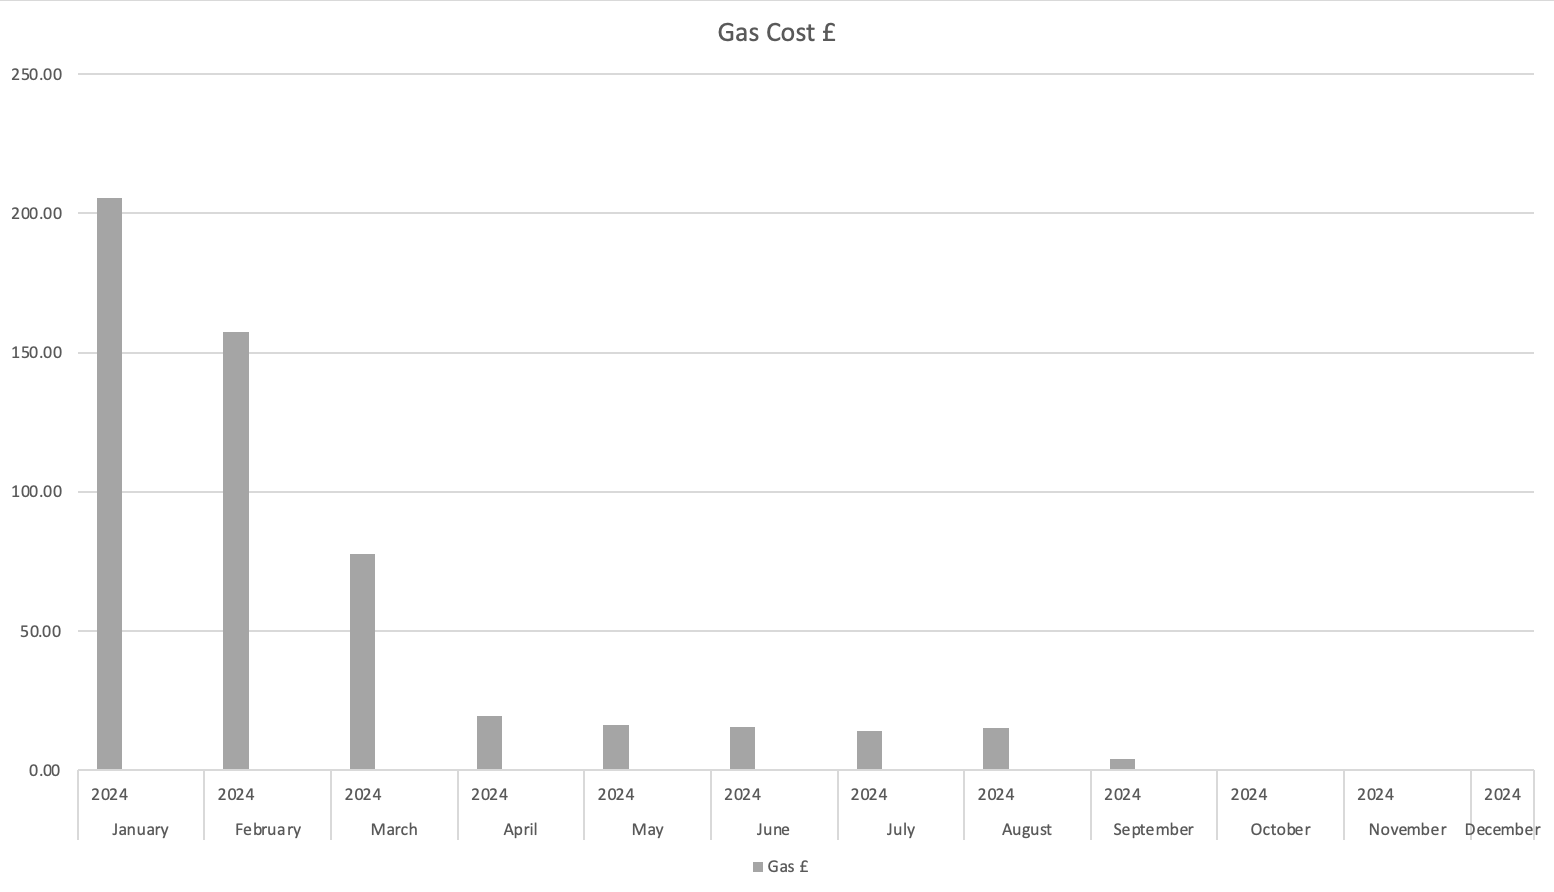
The trend is continuing.
As mentioned at the start of this post, there were a number of ‘free electricity’ sessions during the month, where the ‘free’ element is any electricity you use, over and above your normal usage as viewed over the past 7-10 days during the hour in question, which for all sesssions was 13:00 – 14:00.
The sessions were on 15th, 18th, 21st and 31st of August, this then shows as additional usage on the electricity usage graphs for some of the days in question.
I set the batteries to charge during each of these sessions, however it was only for the third session that I realised that I should discharge my batteries first and only realised this about an hour before the session actually started.
For the last session I started discharging the batteries around 2 hours prior to the event as I can only export at 4.2kW per hour (limited by DNO agreement), whereas I can charge at up to 9.6kW per hour (3.2kW per battery).
This resulted in me using 4.87, 0.14, 2.76 and 10.96kW over and above my normal usage (0.06kW) which in turn equated to savings of £1.18, £0.04, £0.65 and £2.65 respectively for a total of £4.52.
This saving can be combined with any exports for that day which included me ‘dumping’ to the grid of 2.18, 1.82, 1.45 and 3.17kW for further savings of £0.38, £0.27, £0.21 and £0.47 for an additional £1.29 and a total saving of £5.81 over the four sessions.
For the first session, the batteries started at 72% so charged to 100%.
On the second session, the batteries were already at 100% before the start, hence the poor usage.
For the third session the batteries started at 94% as I had only managed to discharge 6% in the half hour before the start when I realised that this would be a good idea.
For the fourth session, although I managed to completely discharge the batteries, they were only at 30% before I started as it was not a particularly sunny day, so did not earn that much from the export.
Not a huge amount saved, but still about two days worth at my current usage for free.