My solar and battery system went live on 14th April 2024 so it has been active for just over a year.
In this post I will concentrate on the generation purely from that initial configuration and make a later post that addresses the East and West arrays and the wider system when they have also completed a year.
The initial configuration that went live was 11 x 450W panels, 6 in my ‘Garage Array’ and 5 in my ‘Office Array’, each with a dedicated micro-inverter, as well as 3 x 5kWh batteries.
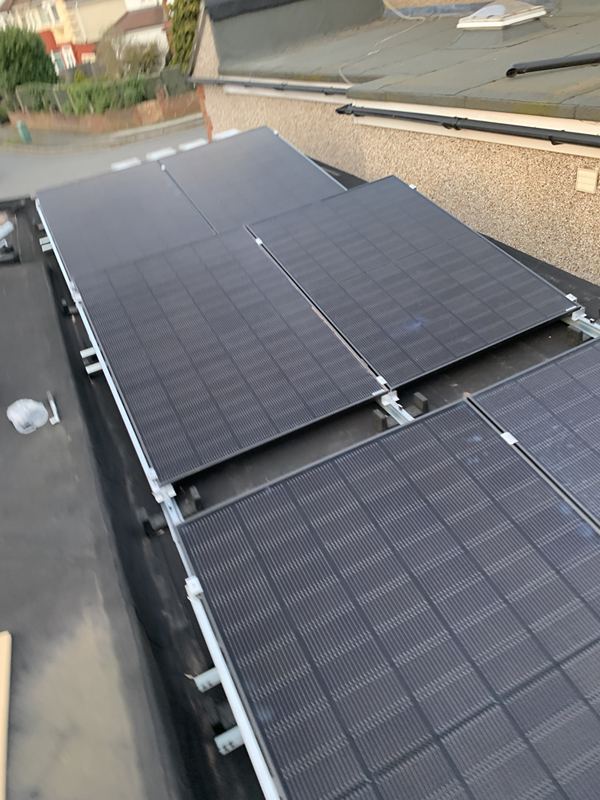
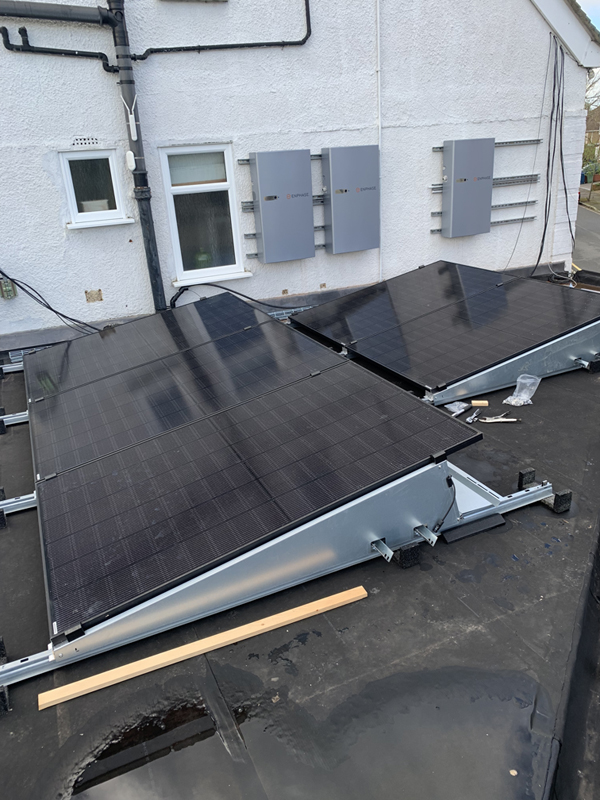
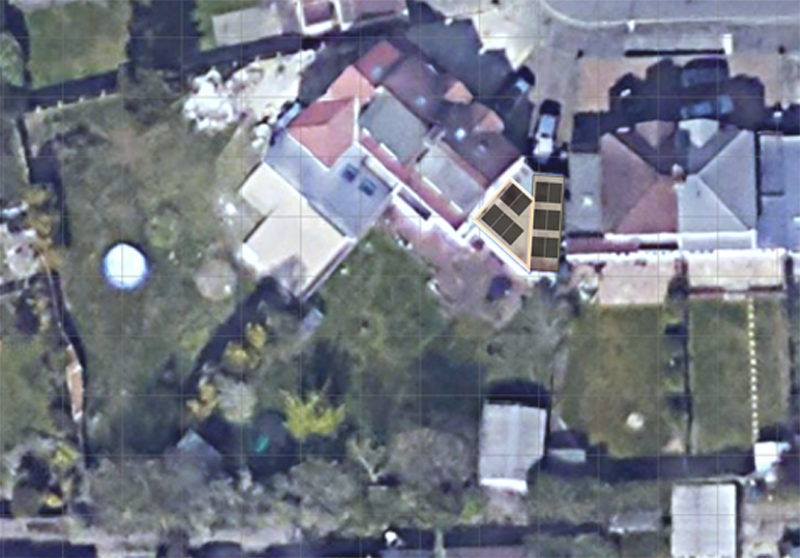
The garage array is about 5 degrees off of due south, the office array is about 15 degrees off of due south, both are elevated at around 10-15 degrees and sat on flat roofs as ballasted installations.
There is a degree of shading on each of these arrays at various parts of the day, in part due to my own house and partly due to my neighbour’s house.
 The garage panels are in theory a 2.3kWh array and the office panels a 1.92kWh array.
Based on the size, slope and azimuth of the arrays, in theory the garage array should produce around 2,74kWh a year (7.51kWh a day) and the office array 2,123kWh a year (5.82 kWh a day).
The actual production figures are as follows:
| Garage | Office | Total | |
|---|---|---|---|
| May | 294.85 | 225.78 | 520.63 |
| June | 345.39 | 267.92 | 613.31 |
| July | 302.85 | 232.84 | 535.69 |
| August | 294.96 | 230.95 | 525.92 |
| September | 194.77 | 156.44 | 351.20 |
| October | 120.41 | 95.53 | 215.95 |
| November | 48.8 | 39.82 | 88.62 |
| December | 24.21 | 29.60 | 54.01 |
| January | 43.49 | 38.66 | 82.16 |
| February | 91.96 | 75.79 | 167.75 |
| March | 236.97 | 194.59 | 431.56 |
| April | 326.78 | 262.99 | 589.76 |
| Total | 2330.83 | 1845.73 | 4176.56 |
So despite the weather being less than optimal last year, the garage array was 30kWh above its array size and the office array was around 70kWh short of its array size, both fell short of their theoretical production values.
The batteries have done their job well in allowing me to shift a large percentage of my electricity usage from peak to off-peak, where I was 70-75% peak usage before the system went live, this dropped to around 26% in May and 23% in June.
It is harder to determine the percentage shift from July onwards that can be purely attributed to these two arrays as the East and West arrays went live at the start of July and helped charge them up during the day.
If we look at just the electricity produced by the garage and office arrays and use the average peak rate for E-ON that I was being charged in 2023 of 0.4026/kWh, they have saved me £938.39 on the garage array and £743.09 on the office array for a combined saving of £1681.49 on solar alone.
The battery shift of usage from peak to off-peak has made further significant savings, which if looked at purely as a charge off-peak, and use during peak hours for an average saving of £0.26/kWh (0.4026 peak – 0.1440 off-peak) for around 440kWh a month (5292.50kWh for the year) gives an additional saving of £1376.83.
Had I stopped here, and using purely these savings, the system would have taken around 6 years to pay for itself.